Field Notes

<--2020-06-09 11:00:00 | 2020-07-08 08:30:00-->
Other sites visited today: Bouldin Corn | East End | West Pond

Bouldin Alfalfa: 2020-07-01 13:45:00 (DOY 183)
Author: Daphne Szutu
Others:

Summary: Regular data collection/cleaning, new game cameras from Arable, spectral, veg height, LAI, biomass samples

2020-07-01
Bouldin Alfalfa

I arrived at 13:45 PDT. It was a warm and breezy day. The alfalfa was flowering and tall, although not very dense, with visible litter between the rows. I was able to drive up to the tower. There were many butterflies and bees buzzing about. Some of the fields to our north were mowed and baled.
The wash reservoir was mostly full; I topped it off. I saw two new game cameras on the tower, installed by Arable. One is looking out toward the horizon and one is looking down toward the ground. I cleaned flux and rad sensors.

I downloaded met, camera, USB GHG, and FD data. I cleared both FD chambers after downloading them. I also took spectral, veg height and 1-wand LAI measurements (facing NE). I took 5 clip plot samples.

LI-7500 readings:
CO2 385ppm
H2O 852ppm
T 31.2C
P 100.8kPa
SS 98--> 102 after cleaning
LI7700 readings:
CH4 1.95ppm
RSSI 64-->75 after cleaning

I left at 15:00 PDT.

Next Mowing: 2020-07-06

Veg Height (cm): Tape measure from ground to top of plant
49, 63, 59, 52, 46, 48, 44, 51, 52, 43, 45, 47, 70, 59, 48, 60, 60, 57, 50, 57, avg = 53, stdev = 7.26

2 photos found

Insect on sonic spikes
20200701BA_insect.jpg ( 2020-07-01 14:02:30 ) Full size: 1440x1920
Insect on sonic spikes

Daphne taking veg height measurements
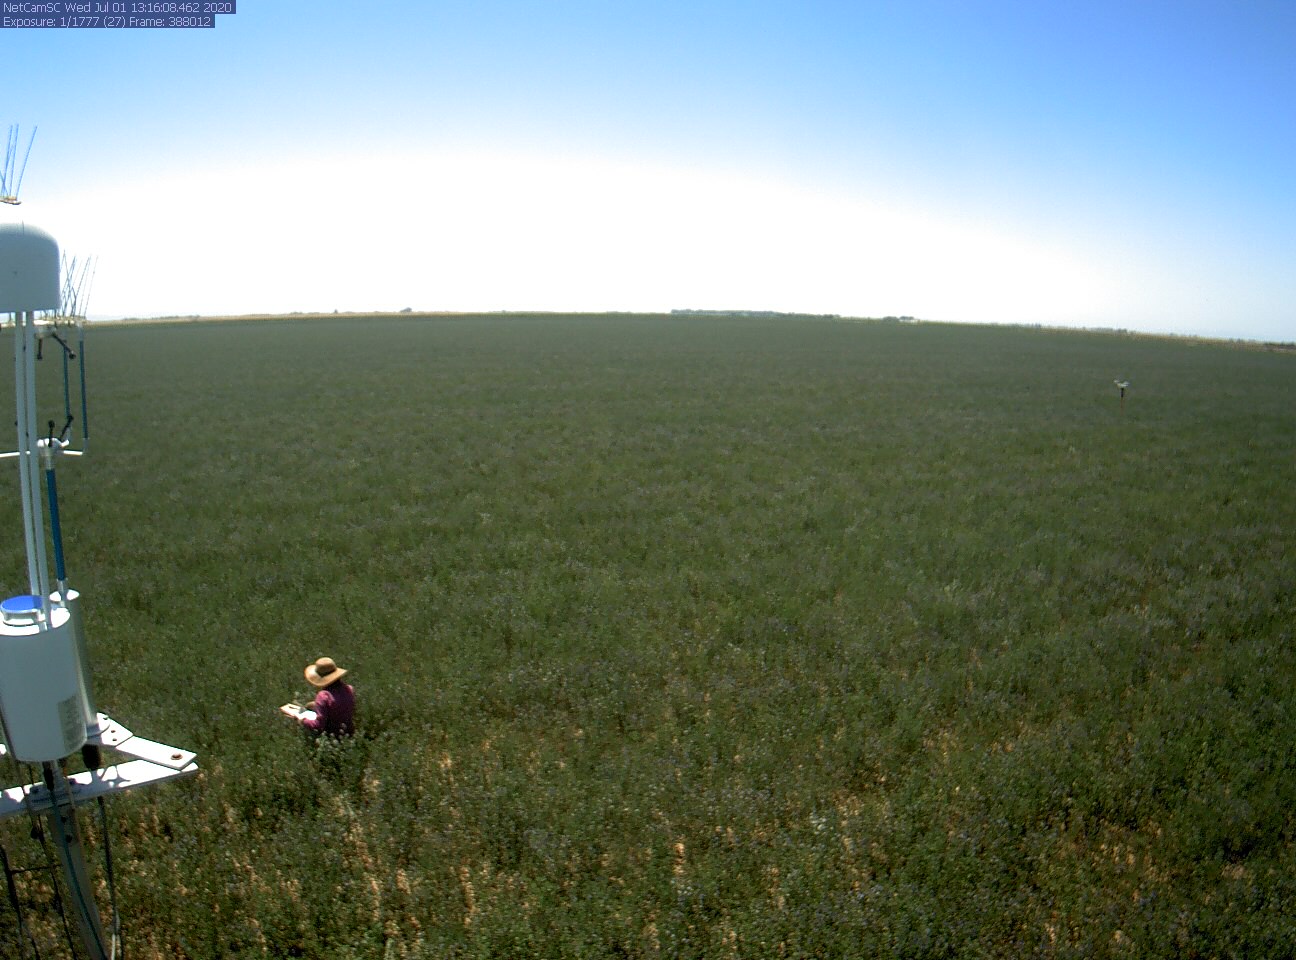
bouldinalfalfa_2020_07_01_131606.jpg ( 2020-07-01 13:17:38 ) Full size: 1296x960
Daphne taking veg height measurements

Graphs display:
7 sets found

5 BA_flux graphs found

Explore the graph:Wind in a new window

Explore the graph:LI-7500 CO2 and H2O in a new window

Explore the graph:7700 CH4 and RSSI in a new window

Explore the graph:Counts in a new window

Explore the graph:CO2 in ppm in a new window

21 BA_met graphs found

Explore the graph:Soil Temperatures Set A in a new window

Explore the graph:Soil Temperatures Set B in a new window

Explore the graph:Soil Temperatures Set C in a new window

Explore the graph:Soil Heat Flux in a new window

Explore the graph:Temperature in a new window

Explore the graph:Solar Radiation in a new window

Explore the graph:Air Pressure and RH in a new window

Explore the graph:Soil Moisture in a new window

Explore the graph:PAR in a new window

Explore the graph:PRI Channels in a new window

Explore the graph:NDVI channels in a new window

Explore the graph:Battery Voltage in a new window

Explore the graph:NDVI and PRI in a new window

Explore the graph:Apogee NDVI in a new window

Explore the graph:FD Chamber A CO2 and Temp in a new window

Explore the graph:FD Chamber B CO2 and Temperature in a new window

Explore the graph:Surface Temperature in a new window

Explore the graph:Sentek Soil Moisture profile in a new window

Explore the graph:Sentek Soil Temperature profile in a new window

Explore the graph:Sentek Soil Salinity profile in a new window

Explore the graph:Forced Diffusion Soil CO2 Flux in a new window

6 BA_arable graphs found

Explore the graph:Incoming Solar Bands in a new window

Explore the graph:Reflected Solar Bands in a new window

Explore the graph:Solar Radiation in a new window

Explore the graph:Temperatures, PPT in a new window

Explore the graph:Sentek Deep Soil Moisture in a new window

Explore the graph:Pressure, RH in a new window

Can't check TATWBABCSB_cam
Can't check MBSWEEWPBCBA
2 BA_processed graphs found

Explore the graph:Energy in a new window

Explore the graph:Evapotranspiration in a new window

No data found for BA_adex.