Field Notes

<--2020-07-01 13:45:00 | 2020-07-21 16:40:00-->
Other sites visited today: Bouldin Corn

Bouldin Alfalfa: 2020-07-08 08:30:00 (DOY 190)
Author: Camilo Rey-Sanchez
Others:

Summary: A-Ci curve measurements. Clipped Alfalfa under the tower

I arrived at 8:30 AM. The sky was clear and there was a mild breeze. The Alfalfa had been recently cut so I took the photosynthesis measurements in the remaining Alfalfa under the tower. I set up a new tent that Joe had to provide some shade for me and the machine during measurements. The measured leaves were fully exposed to the sun. The leaves were smaller than usual and most of the leaves did not cover the 2 cm2 cuvette entirely. The area not covered by the cuvette was estimated based on the projection of the clamped leaf on the 2 cm2 circle. On average there was a 20% of area not covered.

I measured 5 leaves with the first leaf starting at 9:20 AM and the last one at 12:40 pm. The levels of CO2 used in the A-Ci curves were as follows: 400,300,200,150,100,50,400,500,600,700,800,1000,1300 ppm. The light was kept at 1500 umol m-2 s-1 and the temperature was kept ambient. After completing the curve, the leaf was detached and chlorophyll content was measured, and the leaf was collected. I measured a light response curve on the last leaf.

I clipped the alfalfa under the tower after finishing and left at 1:30 PM to do biomass and LAI measurement at Bouldin corn

Next Mowing: 2020-07-31

1 photos found
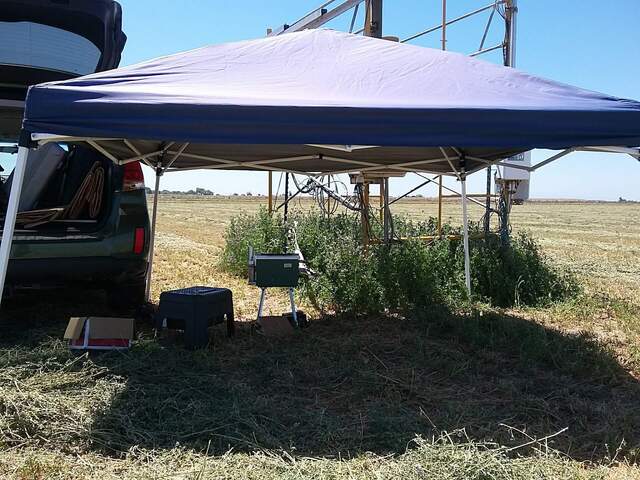
A-Ci curves in the Alfalfa under the tower
20200708BA_ACicurvesUnderTent.jpg ( 2020-07-08 09:30:00 ) Full size: 1920x1440
A-Ci curves in the Alfalfa under the tower

Graphs display:
7 sets found

5 BA_flux graphs found

Explore the graph:Wind in a new window

Explore the graph:LI-7500 CO2 and H2O in a new window

Explore the graph:7700 CH4 and RSSI in a new window

Explore the graph:Counts in a new window

Explore the graph:CO2 in ppm in a new window

21 BA_met graphs found

Explore the graph:Soil Temperatures Set A in a new window

Explore the graph:Soil Temperatures Set B in a new window

Explore the graph:Soil Temperatures Set C in a new window

Explore the graph:Soil Heat Flux in a new window

Explore the graph:Temperature in a new window

Explore the graph:Solar Radiation in a new window

Explore the graph:Air Pressure and RH in a new window

Explore the graph:Soil Moisture in a new window

Explore the graph:PAR in a new window

Explore the graph:PRI Channels in a new window

Explore the graph:NDVI channels in a new window

Explore the graph:Battery Voltage in a new window

Explore the graph:NDVI and PRI in a new window

Explore the graph:Apogee NDVI in a new window

Explore the graph:FD Chamber A CO2 and Temp in a new window

Explore the graph:FD Chamber B CO2 and Temperature in a new window

Explore the graph:Surface Temperature in a new window

Explore the graph:Sentek Soil Moisture profile in a new window

Explore the graph:Sentek Soil Temperature profile in a new window

Explore the graph:Sentek Soil Salinity profile in a new window

Explore the graph:Forced Diffusion Soil CO2 Flux in a new window

6 BA_arable graphs found

Explore the graph:Incoming Solar Bands in a new window

Explore the graph:Reflected Solar Bands in a new window

Explore the graph:Solar Radiation in a new window

Explore the graph:Temperatures, PPT in a new window

Explore the graph:Sentek Deep Soil Moisture in a new window

Explore the graph:Pressure, RH in a new window

Can't check TATWBABCSB_cam
Can't check MBSWEEWPBCBA
2 BA_processed graphs found

Explore the graph:Energy in a new window

Explore the graph:Evapotranspiration in a new window

No data found for BA_adex.