
Field Notes
<--2020-05-03 11:30:00 | 2020-06-02 09:00:00-->Other sites visited today: Mayberry | Sherman Barn
Phenocam link: Searching...
Sherman Wetland: 2020-05-21 12:30:00 (DOY 142)
Author: Daphne Szutu
Others: Joe
Summary: Permanent tower: 7700 calibration, swapped 7500 for calibration, swapped solar charge controller, cleaned conductivity sensor Temp tower: 7700 calibration, swapped 7500 for calibration, adjusted heat flux plates, raised eddy sensors
| 2020-05-21 Sherman Wetland Joe and I arrived around 12:30 PDT. It was a sunny, warm, and breezy day. The wetland is continuing to fill in. I trimmed back the tules that have been growing through the boardwalk. The water level was 92 cm. Joe swapped the solar charge controller because we’ve been having some mid-day power issues: sn KB04456 came off and sn KB15214 went on. The LCD screen on the old one has not been working and there was a mysterious power outage a while ago. We calibrated the 7700 sn TG1-0424. The offsets were small. The 7700 thermocouple seemed fine, so we did not swap it. We also swapped the 7500 for calibration: sn 75H-2180 came off and sn 75H-2182 went on. I sent a new configuration file, updated the pressure coefficients, and reset the 7550 box. I confirmed the 7700 was connected and the USB was logging. I downloaded met, cam, miniDOT and USB GHG data. I synced the phenocam clock with the laptop time (it loses its internal clock when power goes off). I changed the miniDOT batteries and swapped the desiccant for the miniDOT and the water level sensor. The eosGP sensor was out of the water, so I lowered it about 10cm. The wash reservoir was 1/3 empty; we refilled it. Joe cleaned the conductivity sensor (it was a little muddy) and tested it in DI water and in a YSI 10,000 uS calibration solution. Temperature-corrected conductivity readings: Before cleaning, in wetland: 5.27 (Ct, have to check units) After cleaning, in DI water: 0.56 mScm After cleaning, in 10,000 uS calibration soln: 10.6 mScm After cleaning, in wetland: 4.6 mScm As found it was near the bottom in the muck. It was reinstalled a little higher in ‘clear’ water. LI-7500 readings (sn 75H-2180 --> sn 75H-2182): I forgot to write the 7500 numbers after cleaning sn 75H-2180, but they were reasonable. CO2 385ppm --> 412 H2O 778ppm --> 615 T 26.0C --> 25.5 P 101.6kPa --> 101.9 SS 89--> 100 LI7700 readings (before calibration -->after cleaning --> after calibration): CH4 2.2ppm --> 2.0 --> 1.95 RSSI 32--> 85--> 75 We left at 14:05 PDT. 2020-05-21 Sherman Wetland Temporary Tower Joe and I arrived at 14:25 PDT. It was a sunny, warm, and breezy day and gusts. In the last month, the cattails have really come up in front of the tower to 2.5-3m tall. Surprisingly, there is no water in front of the tower. You can walk out to the thermocouples and soil sensors without boots. The eosGP was out of the water, and the water level was below the staff gauge. Joe raised the eddy post up by 63.5 cm: Old height from sonic to ground = 427 cm New height from sonic to ground = 490.5 cm We calibrated the 7700 sn TG1-0211. The offsets were small. We also swapped the 7500 for calibration: sn 75H-2514 came off and sn 0418 went on. I sent a new configuration file, updated the pressure coefficients, and reset the 7550 box. I confirmed the 7700 was connected and the USB was logging. I downloaded met, cam, and USB GHG data. I swapped the desiccant for the water level sensor. The wash reservoir was full; we topped it off. Joe checked the heat flux plates because they had very different diurnal magnitudes. HFP 1 (sn 00245) was NW of the tower, about 15 cm deep in the mud under freshly grown roots. HFP2 (sn 10809) was W of the tower, about 5 cm deep and at a 30 degree angle in dry soil. Joe reinstalled both of them so they were 2cm deep and horizontal. LI-7500 readings (sn 75H-2514 --> sn 75H-2514 after cleaning --> sn 0418): CO2 388ppm --> 404 --> 407 H2O 707ppm --> 626 --> 569 T 26.8C --> 26.9 --> 26.7 P 101.7kPa --> 101.7 --> 101.6 SS 93--> 100 --> 101 LI7700 readings (before calibration -->after cleaning --> after calibration): CH4 1.99ppm --> 1.99 --> 1.90 RSSI 41--> 74--> 72 We left at 15:40 PDT. |
2 photos found
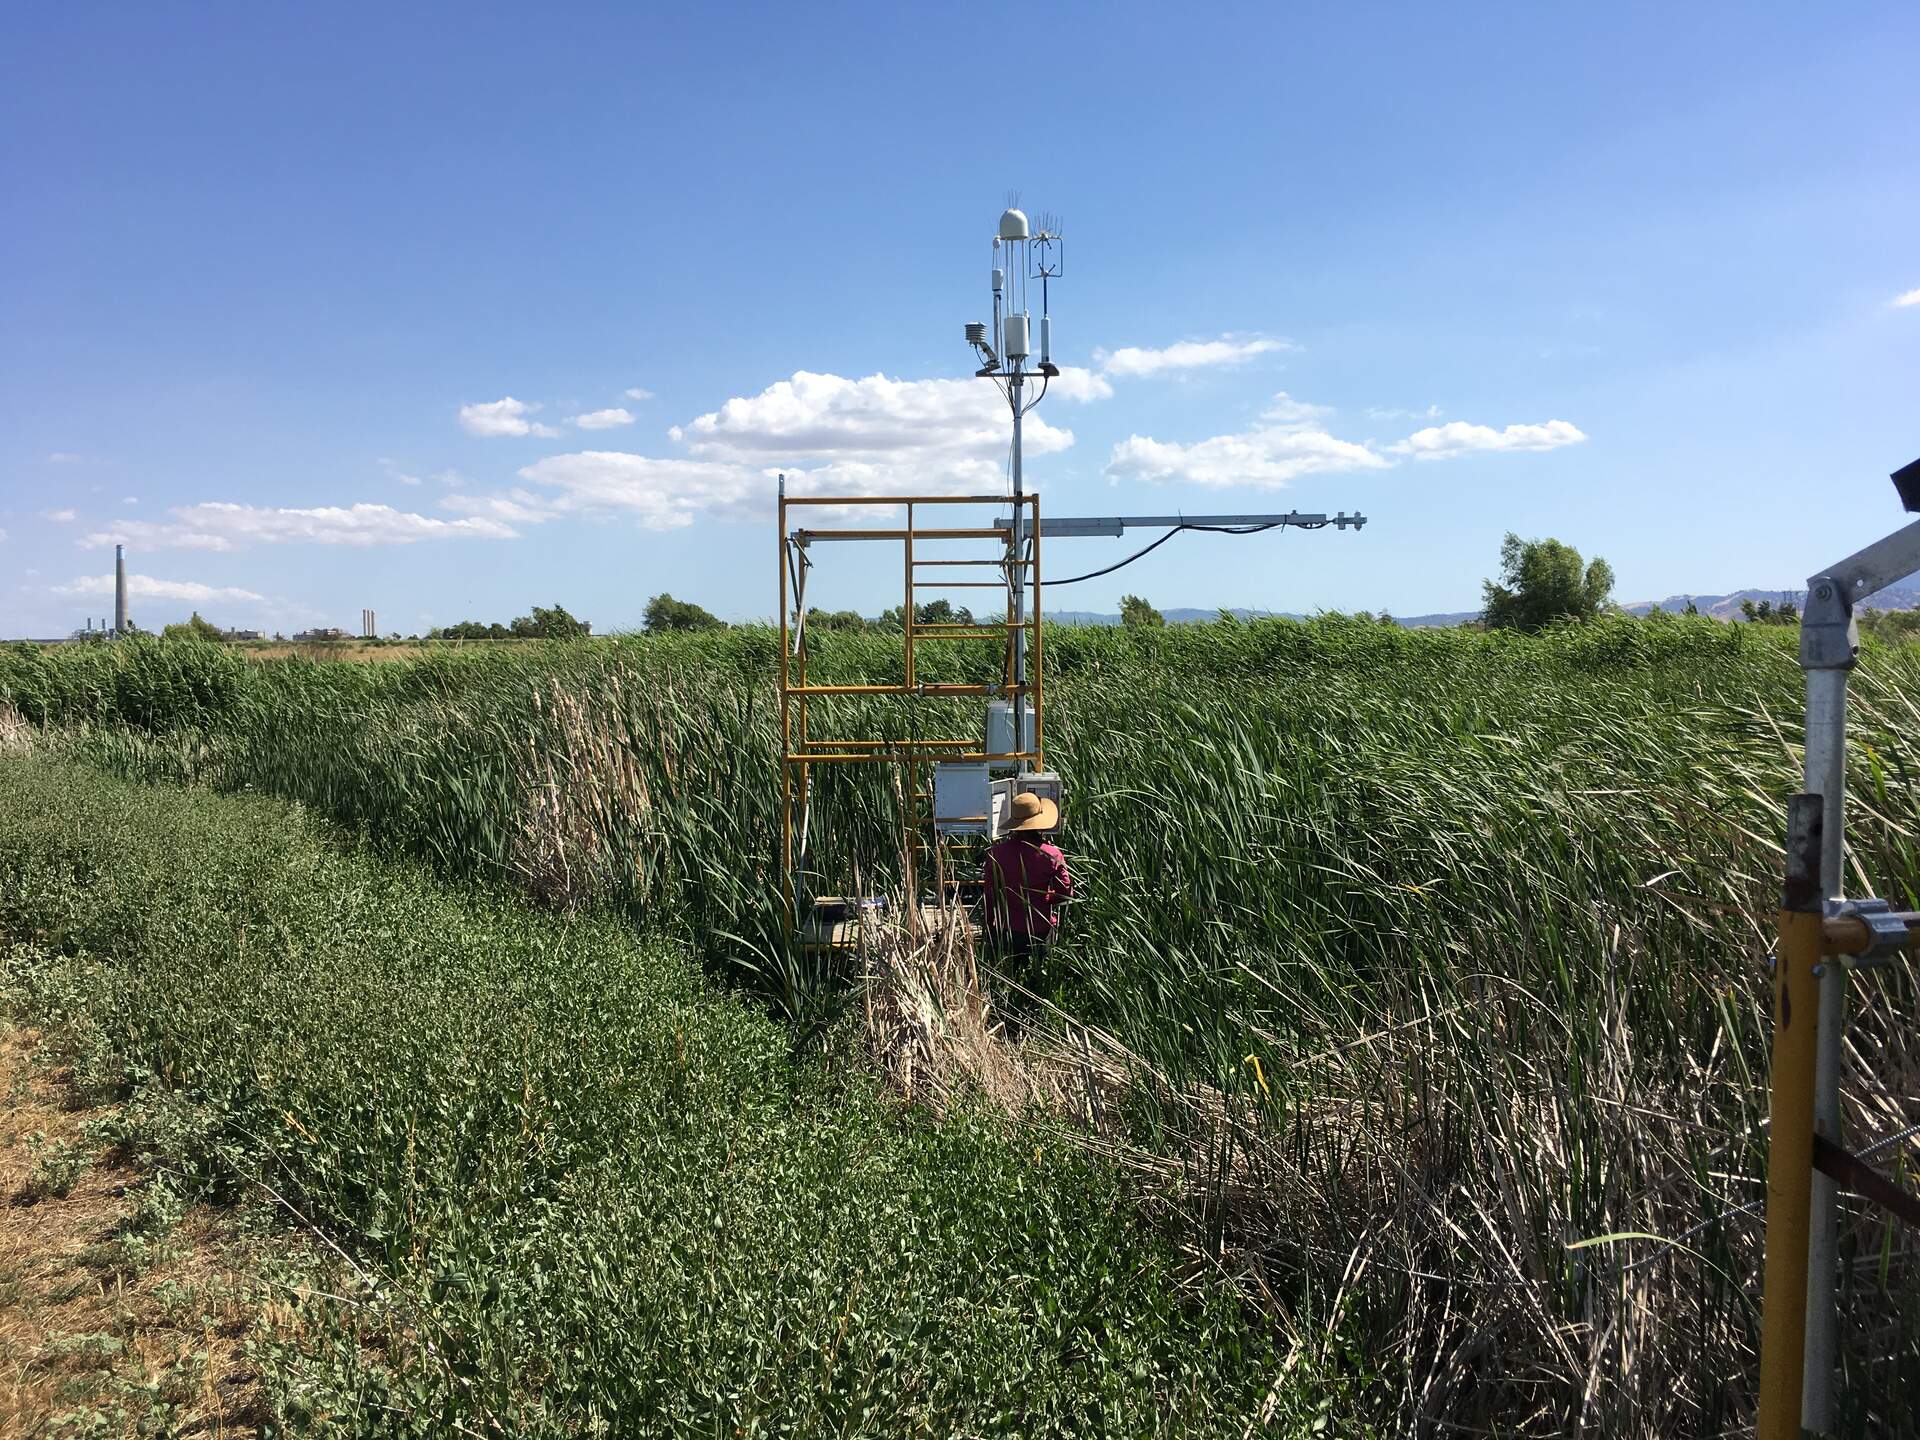
IMG_2559.jpg ( 2020-05-21 15:35:00 ) Full size: 1920x1440
Daphne at the temporary tower.
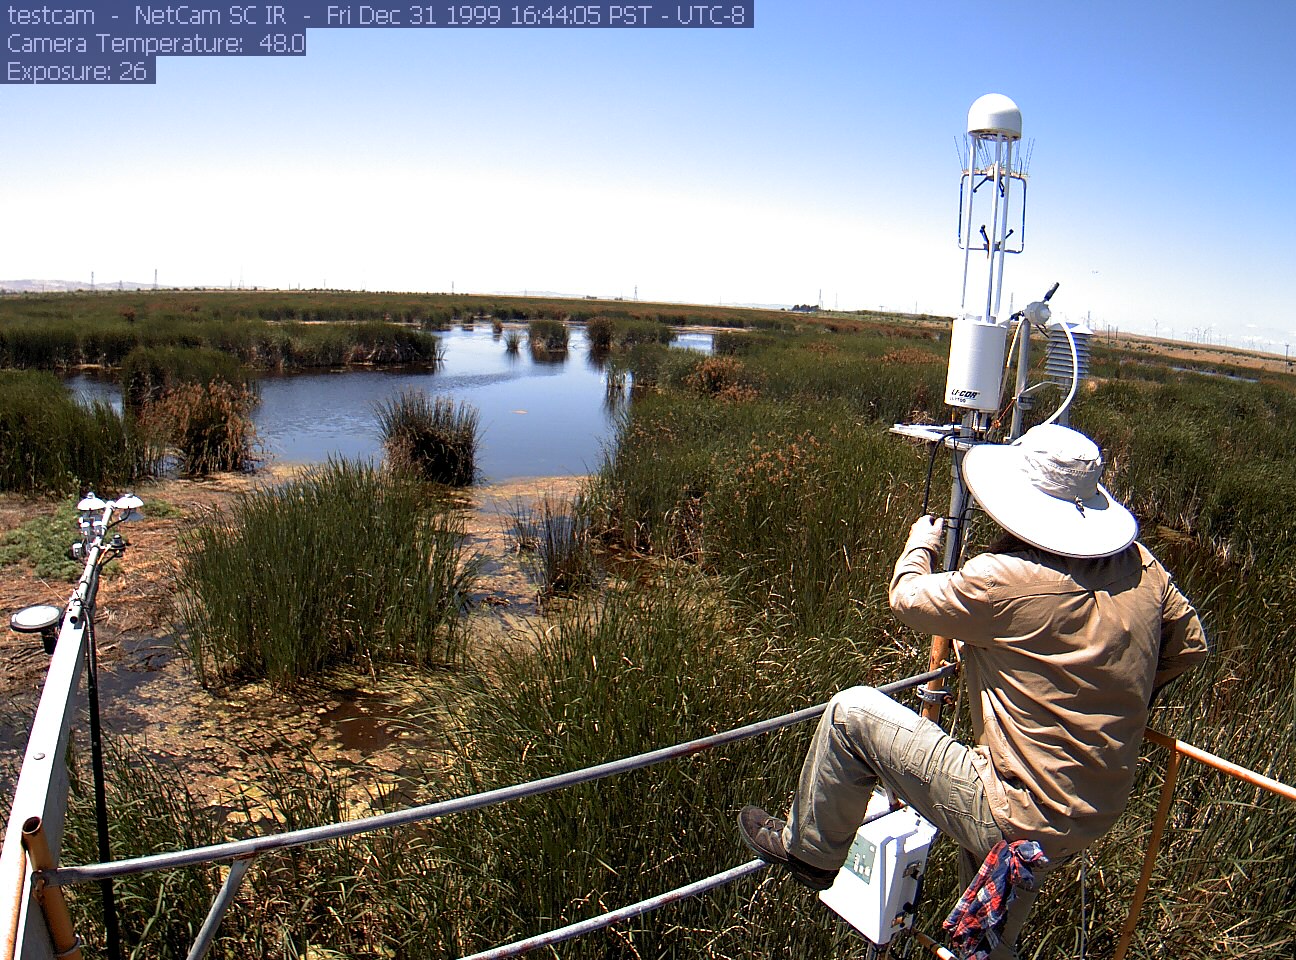
siwetland_2020_05_21_125006.jpg ( 2020-05-21 12:50:06 ) Full size: 1296x960
Joe cleaning flux sensors
7 sets found
Can't check MBWPEESWGT_mixed
Can't check MBEEWPSWEPGT_cam
16 SW_met graphs found
4 SW_flux graphs found
Can't check MBSWEEWPBCBA
Can't check SW_Temp
14 SW_Temp graphs found
3 SW_arable graphs found