Field Notes
<--2020-04-03 15:20:00 | 2020-05-01 10:10:00-->Other sites visited today: Mayberry | Sherman Wetland
Phenocam link: Searching...
Sherman Barn: 2020-04-24 09:15:00 (DOY 115)
Author: Daphne Szutu
Others:
Summary: Regular data collection/cleaning, spectral, abundant weeds, cows on pasture
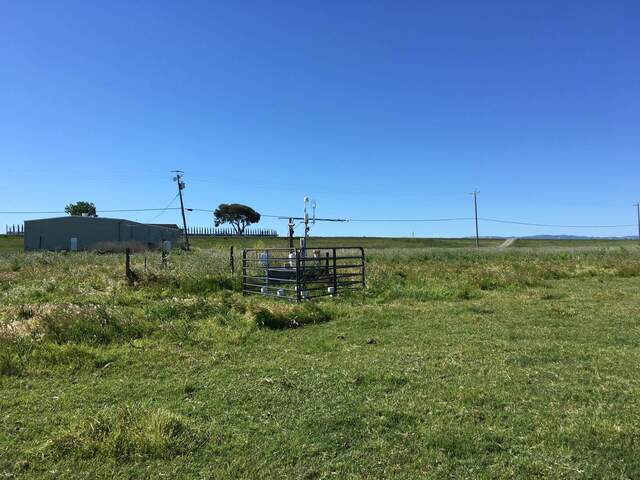
| 2020-04-24 Sherman Barn I arrived at 9:15 PDT. It was sunny and mild, with blue skies and a cool breeze. There were cows grazing to the north and west of our tower. The area around our tower looks lightly grazed, but the weeds are still doing great. Lots of foxtails. I collected met, cam, USB GHG, and gamecam data. I cleaned flux and rad sensors and the camera window. The wash reservoir was mostly full; I topped it off. I changed the water level sensor desiccant and added a few precautionary mothballs to the datalogger box. I took spectral measurements. I checked the 7700 wash spray. There is a small leak in the tubing where it connects to the wash box. This is the ivory-colored tubing that seems to degrade more easily in the sunlight compared to the black tubing. The tubing is degraded on the outside of the bend, as the tubing bends downwards. I rotated the tubing so the leak would be on the inside of the bend. Next time I can fix it with snips and a small ziptie. Other than that, it seemed fine. LI-7500 readings: CO2 418ppm H2O 467ppm T 23.2C P 102.1kPa SS 99--> 101 after cleaning LI7700 readings: CH4 2.08ppm RSSI 35-->79 after cleaning I left at 9:50 PDT. Looking at the data back in the lab, the 7700 started dropping out after a power blip on 2020-04-07. It drops out for about 1/2 a second every 5 seconds. I will check the eddy clocks at the next site visit. |
1 photos found

20200424SB_Weeds.jpg ( 2020-04-24 09:49:21 ) Full size: 1920x1440
Abundant weeds around Sherman Barn tower.
3 sets found
4 SB_flux graphs found
15 SB_met graphs found
Can't check TATWBABCSB_cam

