
Field Notes
<--2020-04-15 00:00:00 | 2020-05-03 11:30:00-->Other sites visited today: Mayberry | Sherman Barn
Phenocam link: Searching...
Sherman Wetland: 2020-04-24 12:00:00 (DOY 115)
Author: Daphne Szutu
Others:
Summary: Permanent tower: Regular data collection/cleaning, fixed phenocam clock, water level above staff gauge Temp tower: Regular data collection/cleaning, rearranged thermocouple depths, water level a little lower, measured well height
| 2020-04-24 Sherman Wetland I arrived at 12:00 PDT. It was sunny and mild, with blue skies and a refreshing breeze. You could hear many birds about. The plants look nice and green. The water level was 106cm (6 cm above the staff gauge). I downloaded met, cam, miniDOT, and USB GHG data. I swapped the miniDOT and water level sensor deisiccants. The wash reservoir was ½ empty; I refilled it. I cleaned flux and rad sensors and the precip bucket funnel, which had some detritus. I reset the phenocam clock: when it was 2020-02-13 12:29, I changed it to 2020-04-24 11:09. It had been reset back to 1999-12-31 last month when we were troubleshooting the solar charge controller. I added a few precautionary mothballs to the datalogger box. LI-7500 readings: CO2 416ppm H2O 448ppm T 25.6C P 101.9kPa SS 97--> 98 after cleaning LI7700 readings: CH4 2.1 ppm RSSI 44--> 71 after cleaning I left at 12:35 PDT. They have re-graded the main gravel road. It’s smoother, wider, and there are no longer the large, shallow potholes when we cross under Antioch Bridge. Back in the lab, I re-named the phenocam photos with the correct dates using Stamp, and used IrfanView batch edit to add a text overlay to the photos with the correct date. 2020-04-24 Sherman Wetland Temporary Tower I arrived at 13:05 PDT. It was a hot afternoon with blue skies and a little breeze. Some of the levee road has been freshly graded, and there were goats/sheep on the parcel south of us. The grass road leading up to the tower has been grazed. Some of the cattails right by the tules looked chewed, but as far as I could tell none of our cables were chewed, surprisingly. There were many wasps buzzing about. I knocked out some small wasps from the datalogger box and put in some mothballs. The water level was a little lower than before. The eosGP sensor I had put in the water last time was out of the water today. I downloaded met, camera, and USB GHG data. I cleaned flux and rad sensors. The wash reservoir was mostly full; I topped it off. I added a bolt to the staff gauge to fix it to the tower and measured the well pipe height from outside the well. Top of well to water level = 68cm Top of well to ground = 74cm Top of well to sensor = ?? Sensor psi reading = 1.14 psi ~ 80 cm I pulled the 3 thermocouple rods, which each had 3 thermocouples taped on. The other 4 thermocouples of each profile were rolled up and hanging in the air, tied to the tower. I tried to make a note of the depth of the thermocouples I pulled out, but it felt like the “soil surface†was a completely arbitrary level since there was at least 10-20cm of floating litter underneath the water surface. After I re-taped the thermocouples at the new depths, I put the rods back in about the same location. For all rods, the “30cm†thermocouple is currently above the water level. The water was up to my knees. Rod 1 (TC 5-11, in tules W of tower): Old depths: air, air, air, air, -24, -32, -40cm New depths: 30, 10, 4, -2, -8, -16, -32cm Rod 2 (TC 12-18, in tules NW of tower): Old depths: air, air, air, air, -10, -19, -27cm New depths: 30, 10, 4, -2, -8, -16, -32cm Rod 3 (TC 19-25, in sparser tules SW of tower): Old depths: air, air, air, air, -24, -30, -38cm New depths: 30, 10, 4, -2, -8, -16, -32cm LI-7500 readings: CO2 406ppm H2O 518ppm T 29.5C P 102.1kPa SS 98--> 100 after cleaning LI7700 readings: CH4 2.0ppm RSSI 34--> 69 after cleaning I left at 15:45 PDT. Looking at the data back in the lab, AirT seems to be dropping out sporadically. I'll look at it next time. Maybe just a loose wire. |
2 photos found
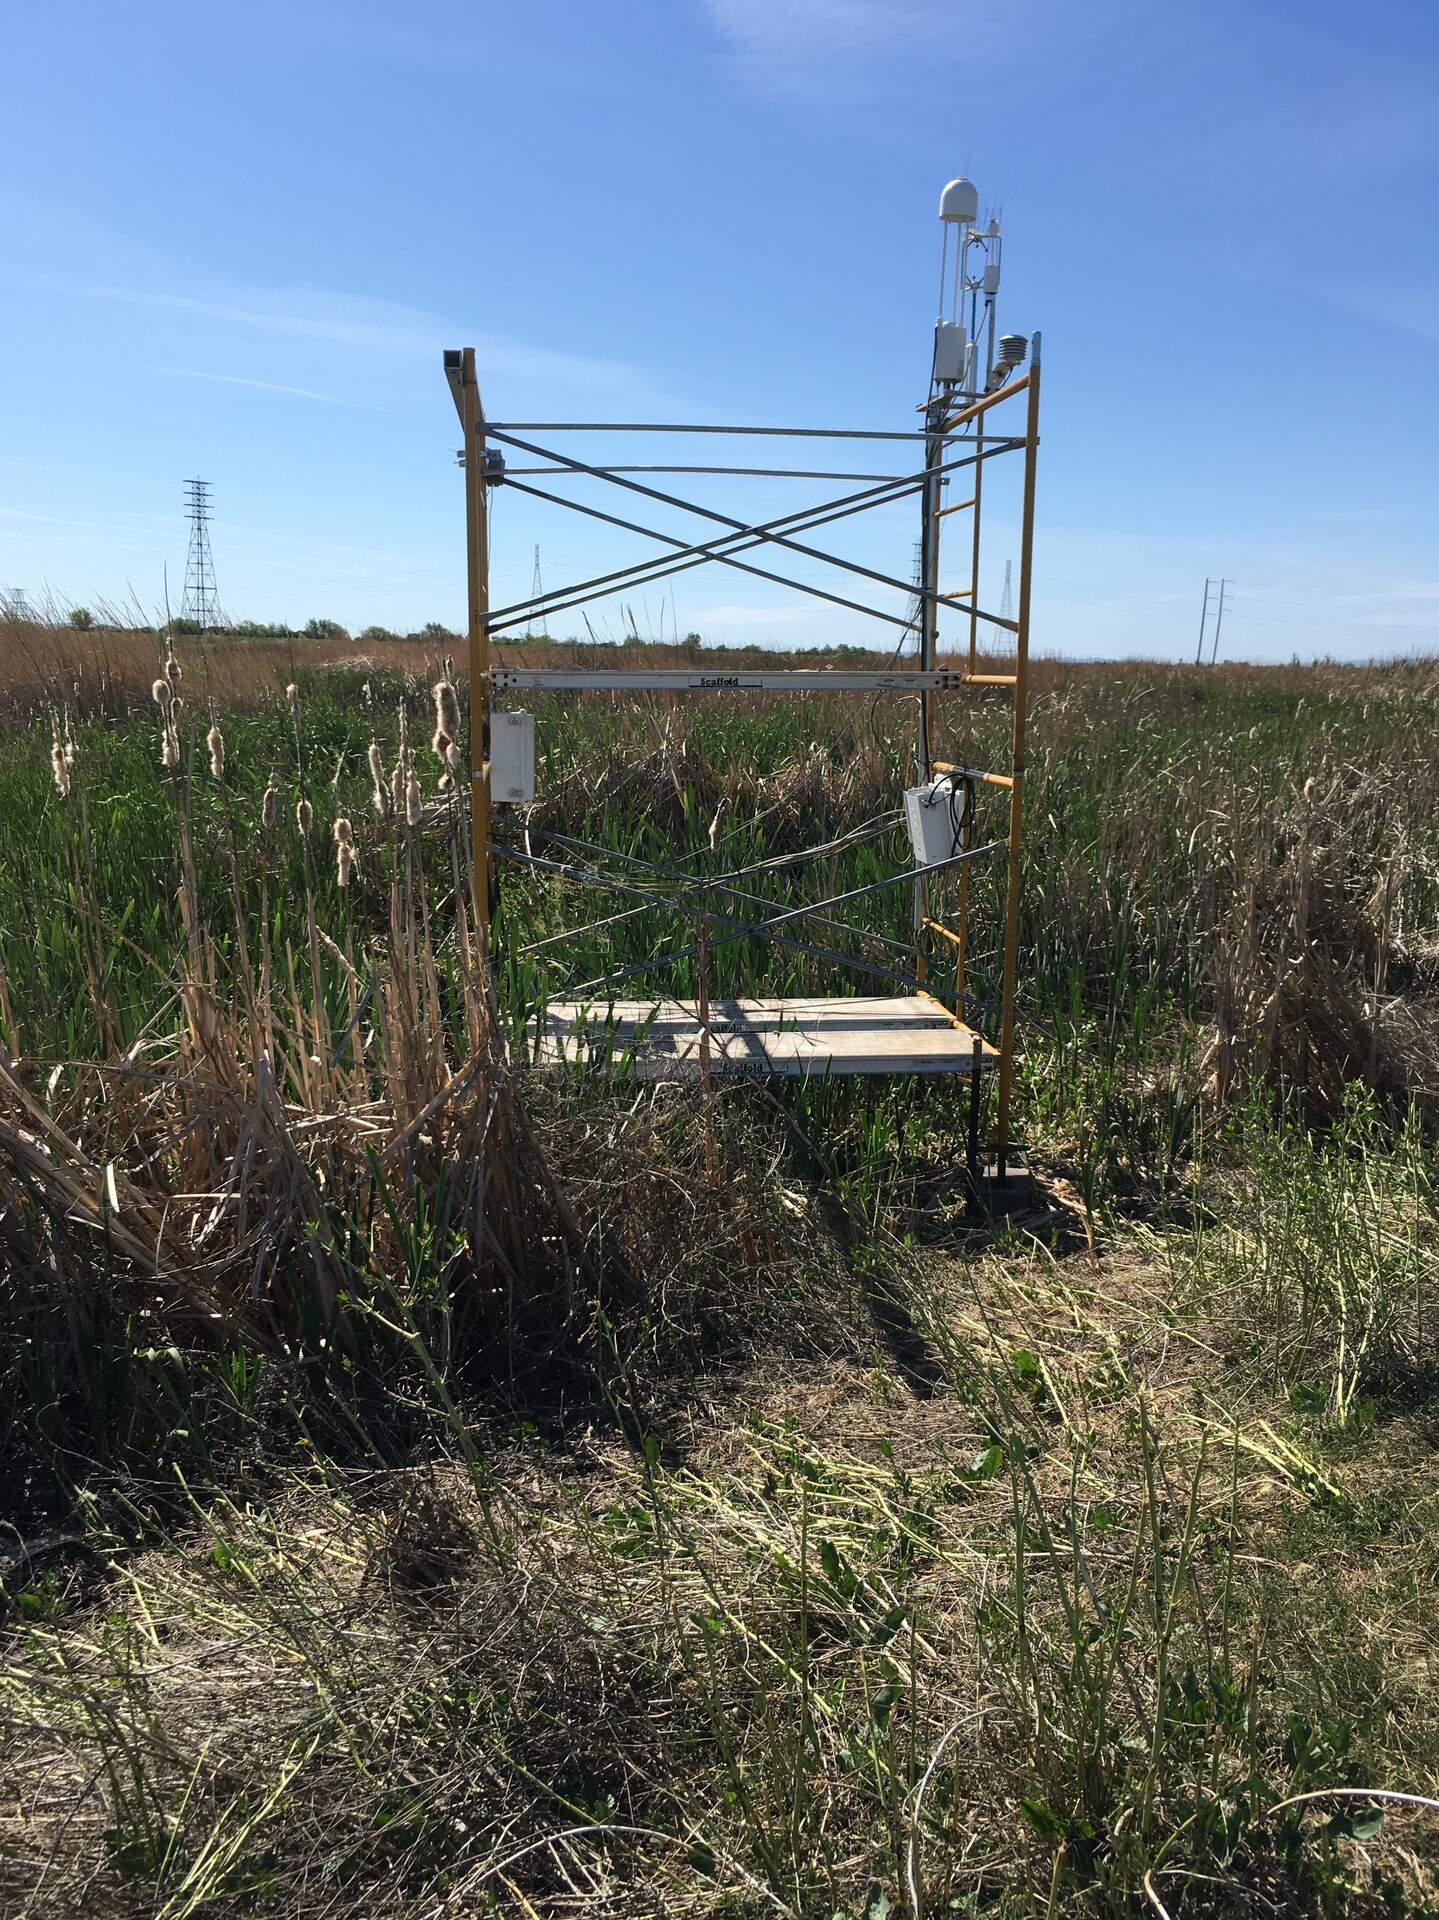
20200424SW_TempTower.jpg ( 2020-04-24 15:44:48 ) Full size: 1439x1920
Greening up in front of Sherman Wetland Temporary Tower. The area between the tower and the dirt road (where the picture is taken) has been grazed by sheep.

20200424SW_GreenVeg.jpg ( 2020-04-24 12:33:21 ) Full size: 1920x1122
Green reeds at Sherman Wetland.
7 sets found
Can't check MBWPEESWGT_mixed
Can't check MBEEWPSWEPGT_cam
16 SW_met graphs found
4 SW_flux graphs found
Can't check MBSWEEWPBCBA
Can't check SW_Temp
14 SW_Temp graphs found
3 SW_arable graphs found