Field Notes
<--2020-03-11 11:00:00 | 2020-04-11 10:00:00-->Other sites visited today: Bouldin Alfalfa | Bouldin Corn | East End | Mayberry | Sherman Barn | Sherman Wetland
Phenocam link: Searching...
West Pond: 2020-04-03 12:55:00 (DOY 94)
Author: Daphne Szutu
Others: Mike
Summary: Regular data collection/cleaning, first site visit in a month
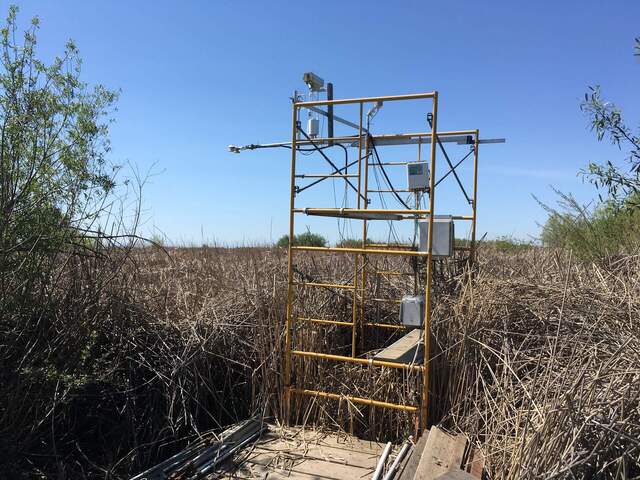
| 2020-04-03 West Pond Mike and I arrived at 12:55 PDT. It was a mild, sunny, and breezy day. The wetland is still brown but there are some green tules starting to come up. The inlet was off but leaking some water through the PVC connections. The water level was 6 cm. It has been dry recently, but it’s expected to rain for 3 days starting tomorrow. This is the first site visit in a month. The Bay Area is on the third week of COVID-19 shelter-in-place orders, with at least 4 more weeks to go. I downloaded met, camera, and USB GHG data. The wash reservoir was 2/3 full; I refilled it. I cleaned flux and rad sensors. There were some ants in the datalogger box, but no mothballs in the blue bag. LI-7500 readings: CO2 410ppm H2O 312ppm T 19.8C P 101.7kPa SS 95--> 96 after cleaning LI7700 readings: CH4 1.95ppm RSSI 37--> 71 after cleaning We left at 13:25 PDT. |
1 photos found

20200403WP_Tower.jpg ( 2020-04-03 13:24:24 ) Full size: 1920x1440
WP tower ok after a month.
8 sets found
Can't check WP_DO
1 WP_DO graphs found
14 WP_met graphs found
5 WP_flux graphs found
Can't check MBWPEESWGT_mixed
Can't check MBEEWPSWEPGT_cam
Can't check MBSWEEWPBCBA
1 WP_processed graphs found
No data found for WP_arable.

