
Field Notes
<--2019-08-08 10:55:00 | 2019-08-19 09:20:00-->Other sites visited today: West Pond
Phenocam link: Searching...
Bouldin Alfalfa: 2019-08-16 07:30:00 (DOY 228)
Author: Joe Verfaillie
Others: Daphne, Camilo, Housen
Summary: Field freshly mowed - not raked or baled. Set up CH4 release experiement - two points, and secondary tower plus extra sonic, RH/T. LI-6400 leaf level measurements
| 2019-08-16 Bouldin Alfalfa Housen and Daphne arrived around 7:30 in his car, and Camilo and Joe arrived about 15 minutes later in the small rental truck after dropping Robert and Ariane off at West Pond. It was a sunny and warm day, with clear skies and horizons hazy. They had just mowed the alfalfa within the last few days. There was water in the irrigation ditch east of the field, and the inlet on the southern end of the irrigation ditch was gushing. Daphne downloaded met and USB GHG data. She added two HMP sensors to the met program, and uploaded the new program to the CR1000. She also cleaned the flux sensors on the main tower (RSSI 70 --> 76), and synced the heater settings for the two 7700s. Camilo worked on 6400 measurements using the uncut alfalfa under the tower. Three leaves were measured for A/Ci curves. The last two also included a light response curve with fluorescence on the same section of the leaf. The light response curve was immediately done after the A/Ci curve. Chlorophyll content was measured after the completion of the curves and the leaves were harvested and collected to calculate area and dry mass. The group worked on setting up the CH4 release experiment. Housen and Joe set up two points of methane release. At each release point, there was a pure methane tank, a solar power system, a CR10X to control timing of the gas release, and a black ABS pipe with 3 outlets installed 30 cm above the ground. The clocks on the two CR10Xs were synced to the laptop time. [distance between outlets facing into the wind. Heading from tower?] Closer release (daytime) Distance from tower: 20 m Flow rate: 1.25L/min – each of the three outlets were just under 1cfph Hours of release: 6:00 to 21:00 Gas control: pressure controller CR10X: sn 27930 Solar controller: sn 12501588 Farther release (nighttime) Distance from tower: 180m Flow rate: 2.4L/min – each outlet was at about 0.8L/min Hours of release: 18:00 to 9:00 Gas control: motorized ball valve CR10X: sn 47253 Solar controller: sn 12501584 The start and end time of the daytime release (daytime from 6 am to 9 pm) was: start2='2019-08-16 10:00'; end2='2019-08-19 12:00'; The start and end time of the nighttime release (nighttime from 6 pm to 9 am) was: start2='2019-08-21 18:00'; end2='2019-08-24 09:00'; At the farther release point, we tested the flow rate by first uploading the AM data logger program. We uploaded the PM data logger program (which stopped the flow) at 10:50 PST. We set up a second flux tower near the northwest corner of our main tower and installed a LI-7500, a LI-7700, and two sonics. The power for the second tower was connected to the tower's 24V screw terminal. LI-7500, sn 0073, z = 2.1m LI-7700, sn TG1-0396, z = 2.1m LI-7550, sn AIU-1866 Sonic (upper), sn 153805, z=2.1m Sonic (lower), sn 120907, z=0.4m and installed upside down Second tower LI-7500 readings: CO2 421ppm H2O 776ppm T 35.2C P 100.5kPa SS 100 Second tower LI7700 readings: CH4 2.0ppm RSSI 66 We also installed two additional HMP60s to create a temperature profile. Both sensors and the fans for both sensors were connected to the tower's 12V pluggable power strip. After they were installed, the upper HMP60 read 28.8C / 44.5%, the tower HMP45 read 30.9C / 45.2%, and the lower HMP60 read 31.8C / 47.8%. HMP60 (AirT_2 and RH_2), sn G4540023, z=5.68m HMP60 (AirT_3 and RH_3), sn L1740398, z=0.4m Joe rinsed off the solar panels and trimmed some of the alfalfa by the 2nd tower. Camilo sprayed the wasps' nests under the radiation boom before leaving. Joe and Daphne left first, around 11:50, to go pick up Ariane, Robert, and Ariane's soil cores at WP. Housen and Camilo left a bit later to head directly back to campus. |
Next Mowing: 2019-09-21
6 photos found
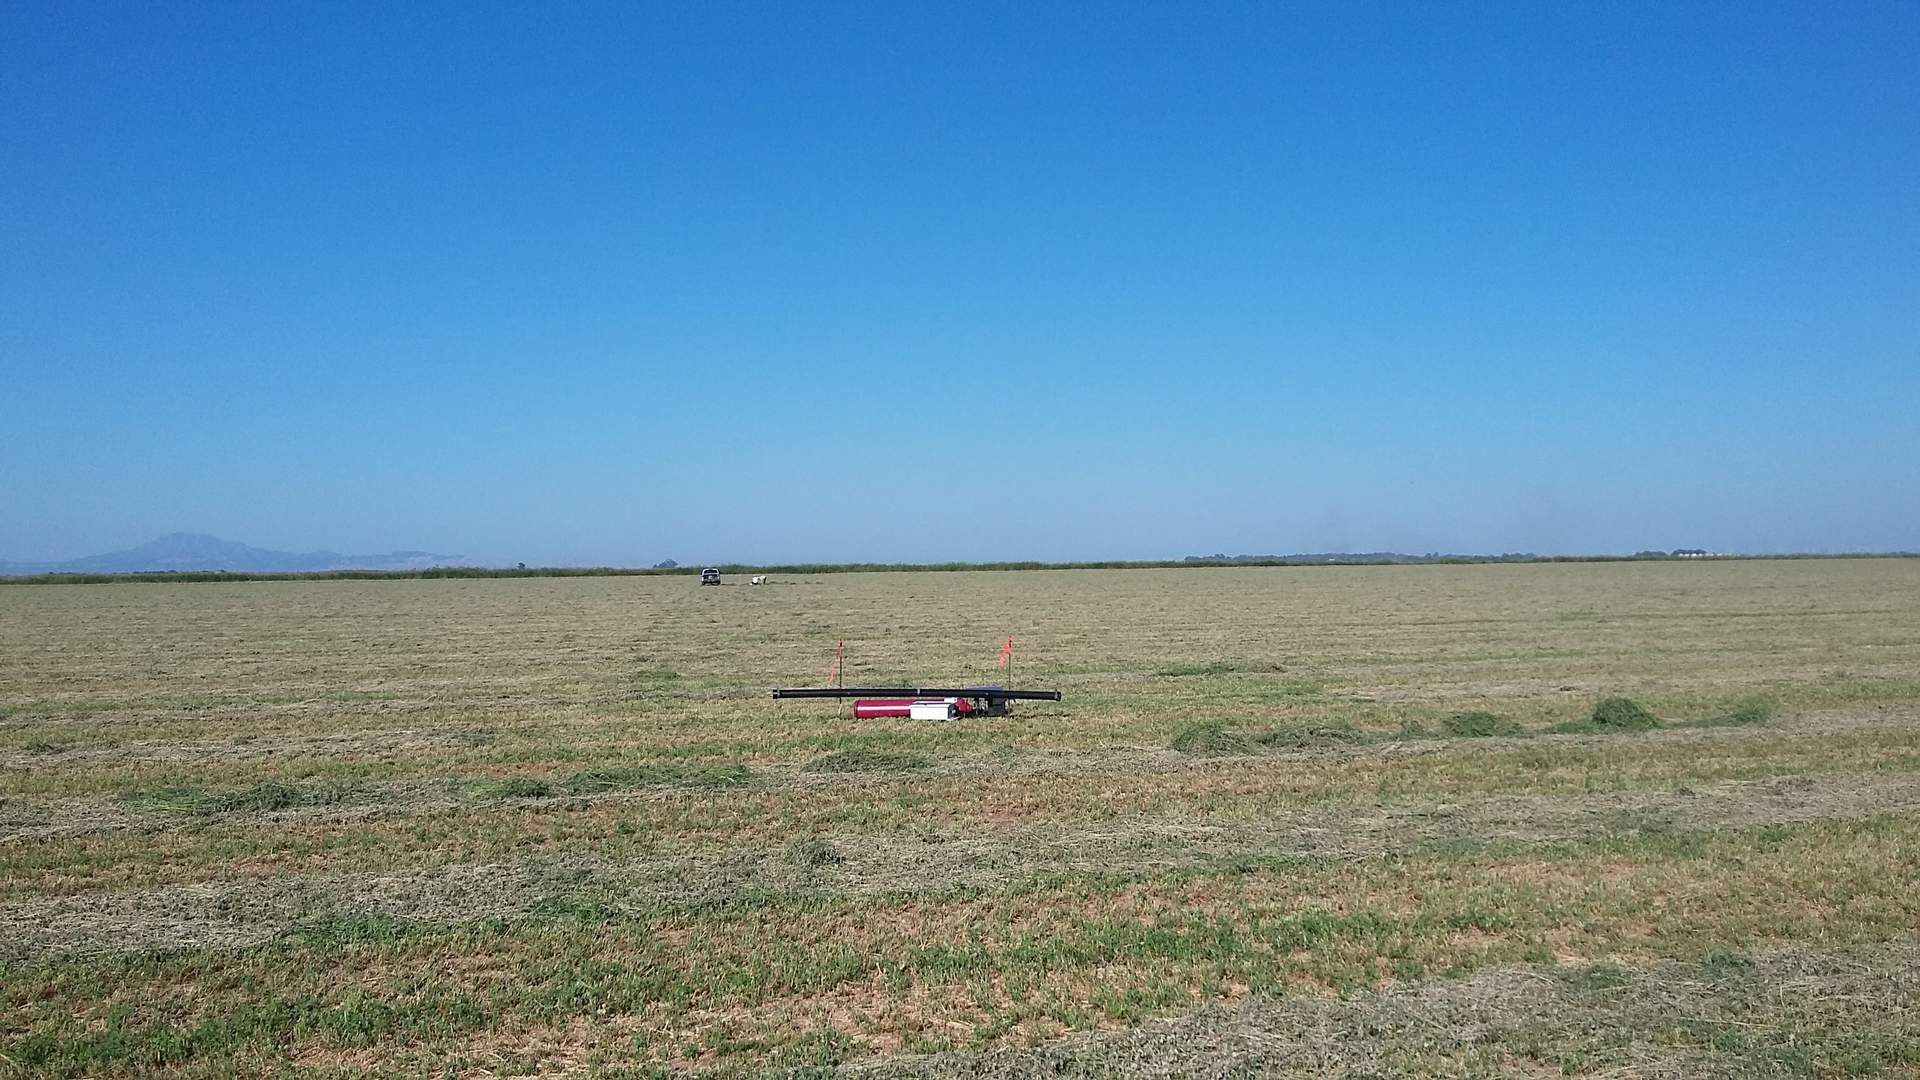
20190816BA_CH4ReleasePoints.jpg ( 2019-08-16 08:54:41 ) Full size: 1920x1080
View of the two CH4 release points from the tower
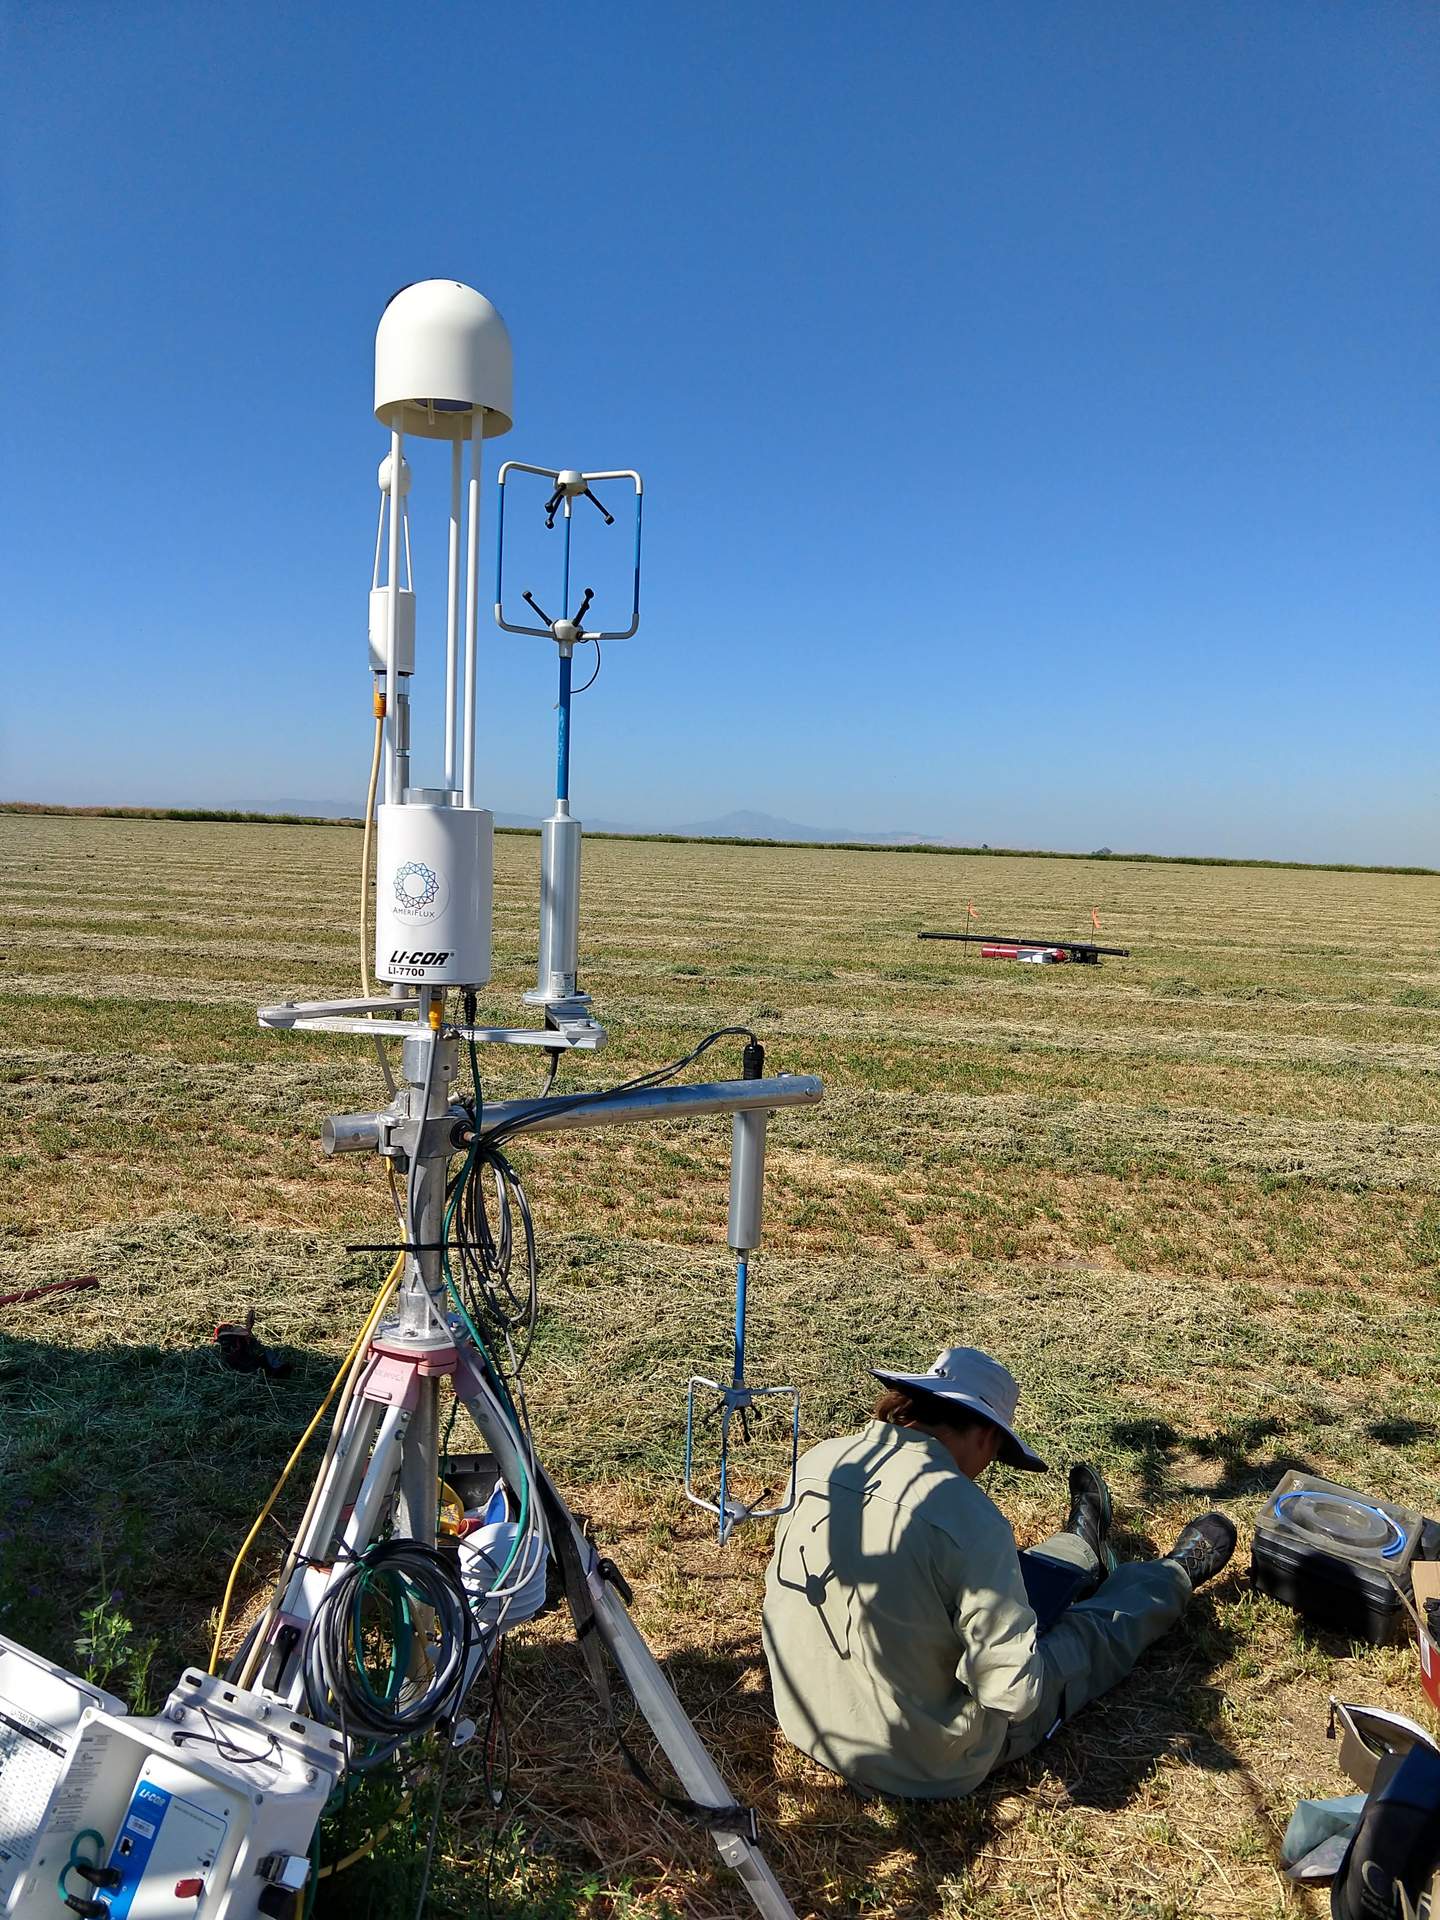
20190816BA_JoeSeondaryTower.jpg ( 2019-08-16 10:21:11 ) Full size: 1440x1920
Joe sitting next to the secondary tower for CH4 release experiement
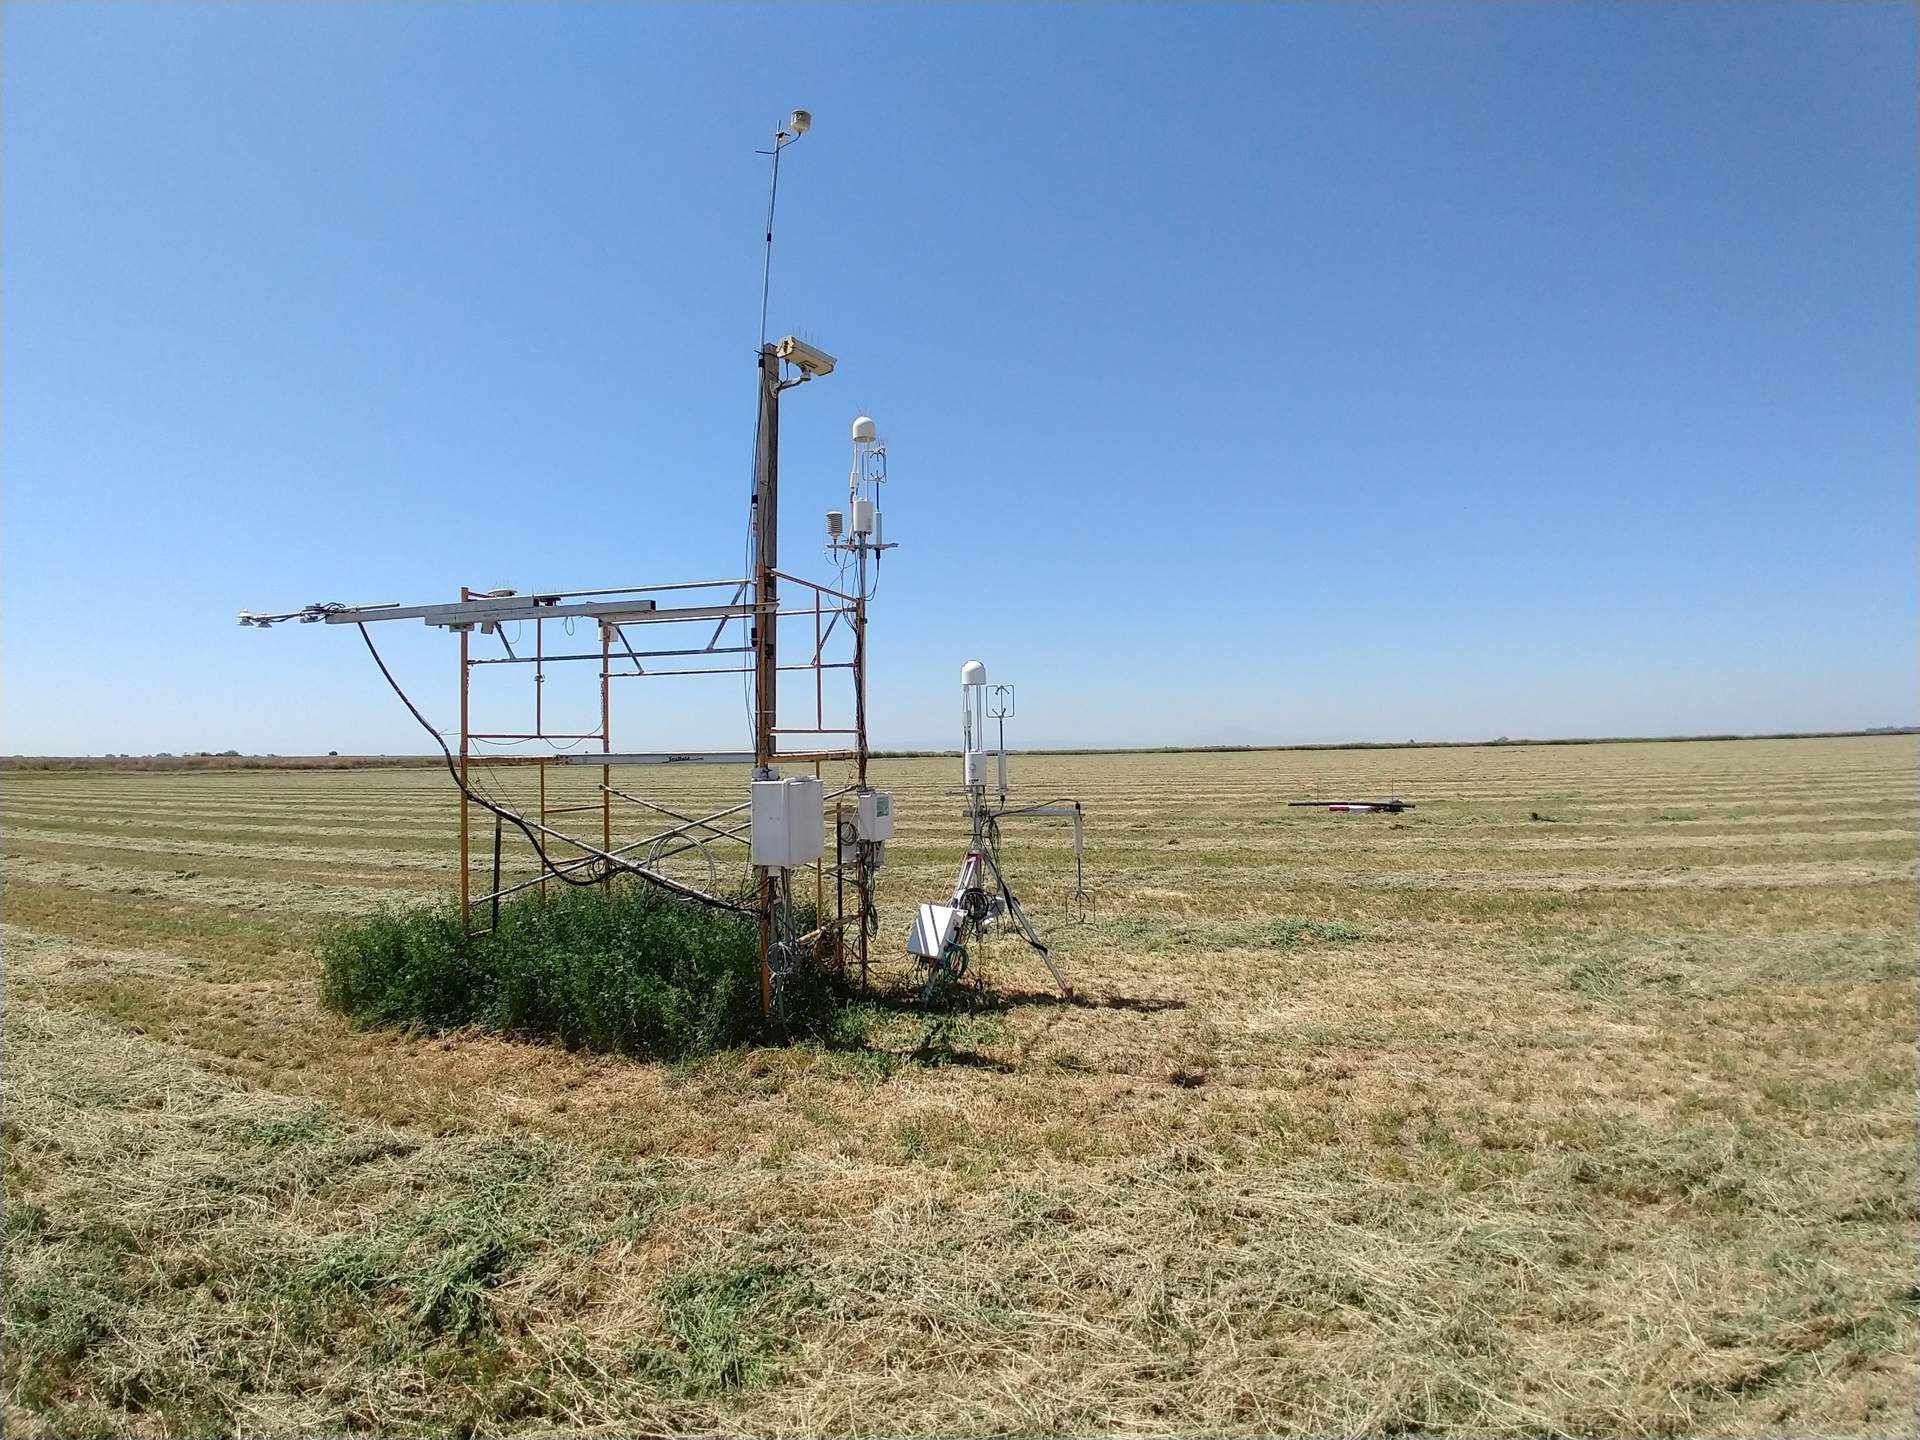
20190816BA_CH4Experiement.jpg ( 2019-08-16 12:12:16 ) Full size: 1920x1440
Finished setup for second CH4 release experiement
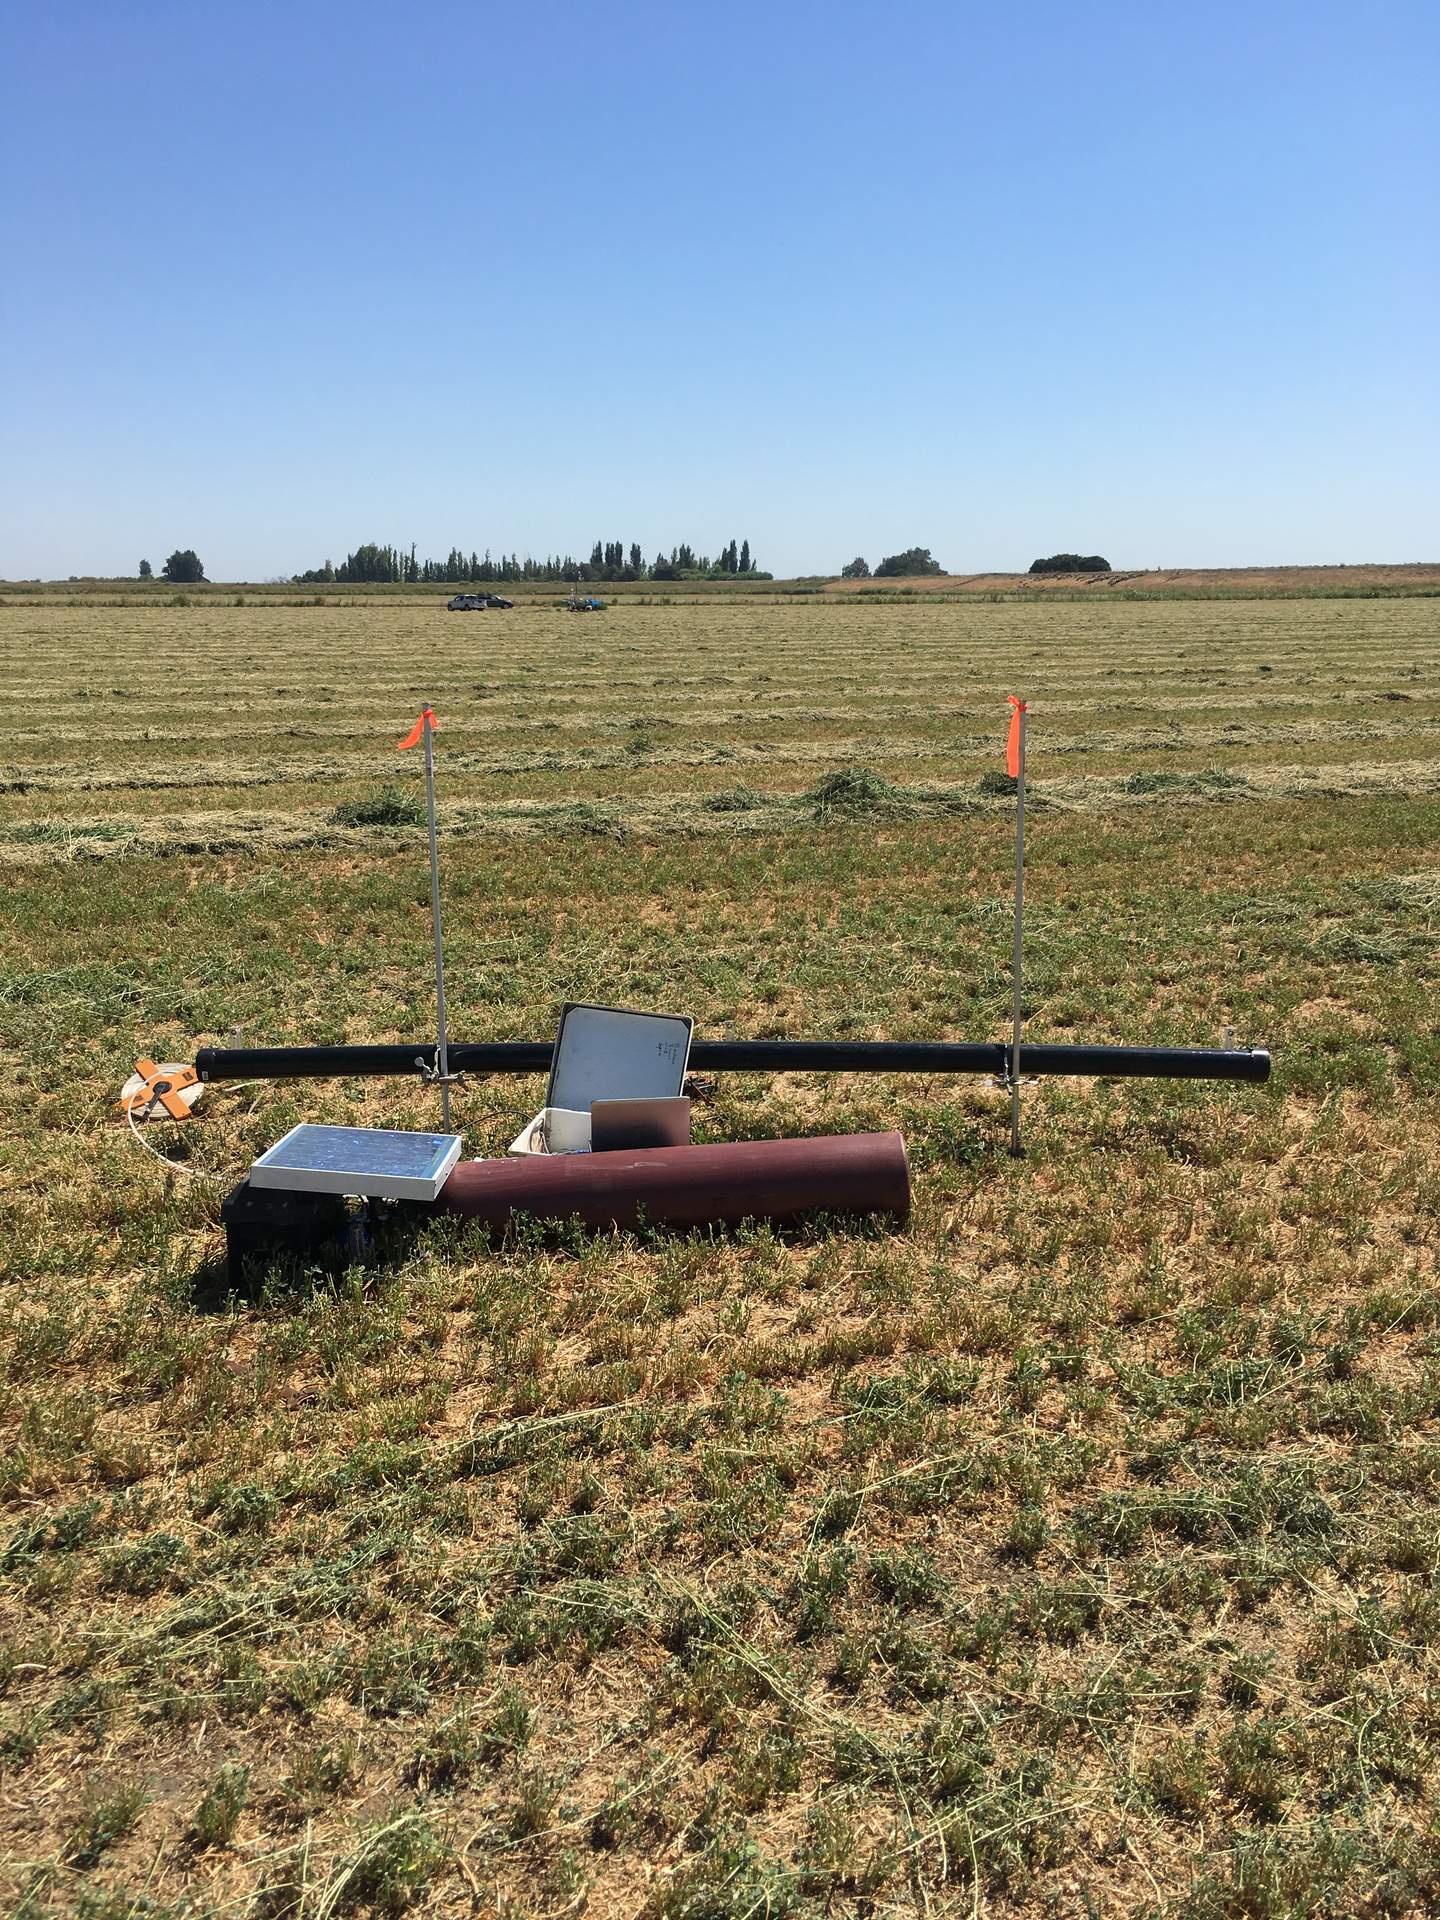
20190816BA_FarCH4Point.jpg ( 2019-08-16 00:00:00 ) Full size: 1440x1920
View of the tower from the far CH4 release point
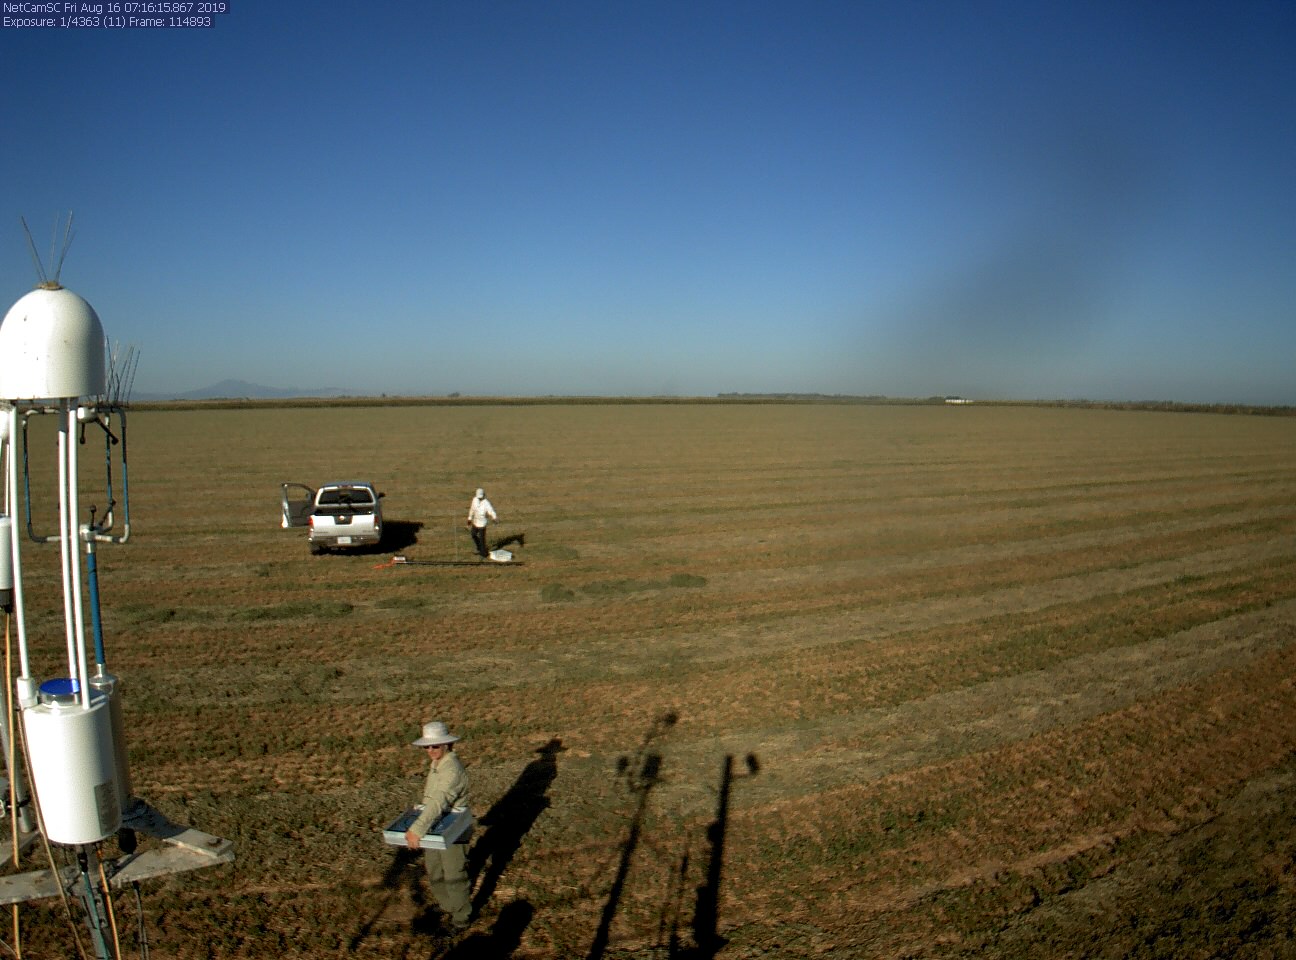
bouldinalfalfa_2019_08_16_071611.jpg ( 2019-08-16 07:25:54 ) Full size: 1296x960
Setting up CH4 release experiment
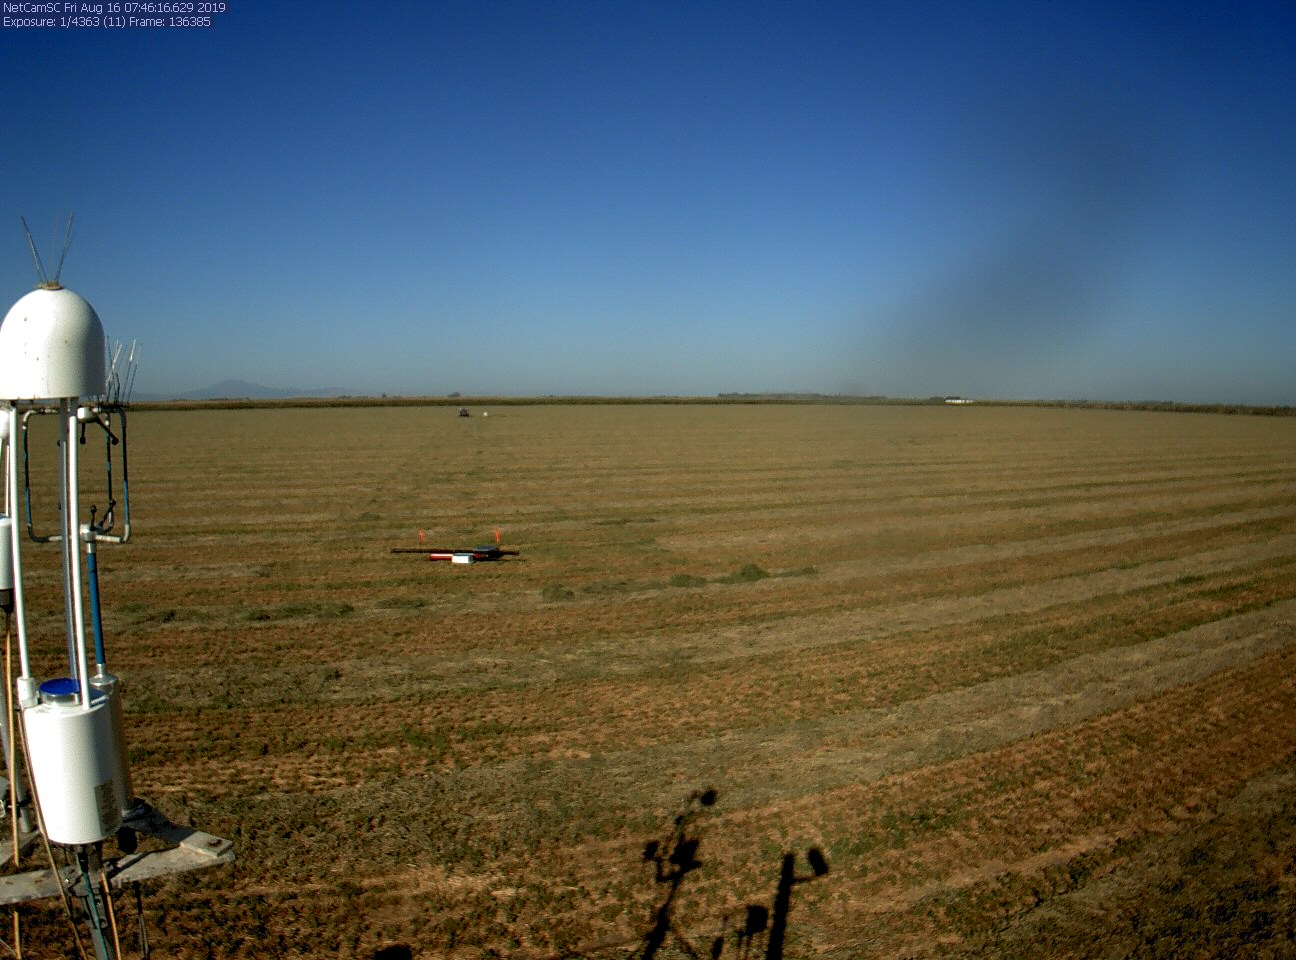
bouldinalfalfa_2019_08_16_074612.jpg ( 2019-08-16 07:55:56 ) Full size: 1296x960
Near and far CH4 release experiment
7 sets found
5 BA_flux graphs found
21 BA_met graphs found
6 BA_arable graphs found
Can't check TATWBABCSB_cam
Can't check MBSWEEWPBCBA
2 BA_processed graphs found
No data found for BA_adex.