Field Notes

<--2018-08-23 13:30:00 | 2018-09-05 13:55:00-->
Other sites visited today: East Pond | East End | Bouldin Alfalfa | Bouldin Corn | West Pond

Sherman Barn: 2018-08-27 15:15:00 (DOY 239)
Author: Alex Valach
Others: Kuno, Tyler, Siyan

Summary: Soil sampling campaign (aug) part I

We arrived at the site around 15:15.

We took two transects (T1 to the north, T2 south) of 5 samples each (P1-P5) at three depths (0-15cm, 15-30cm, and 30-60cm) 5m apart going west starting from the tower.

The water table was around 50-60cm.

We left around 16:00.

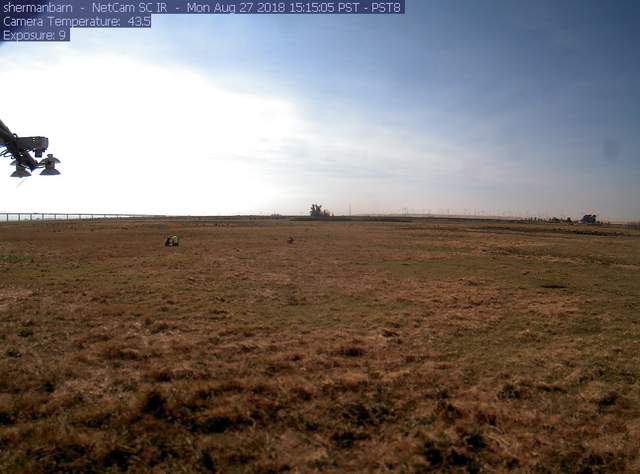
3 photos found

Soil sampling
shermanbarn_2018_08_27_151506.jpg ( 2018-08-27 15:19:56 ) Full size: 1296x960
Soil sampling
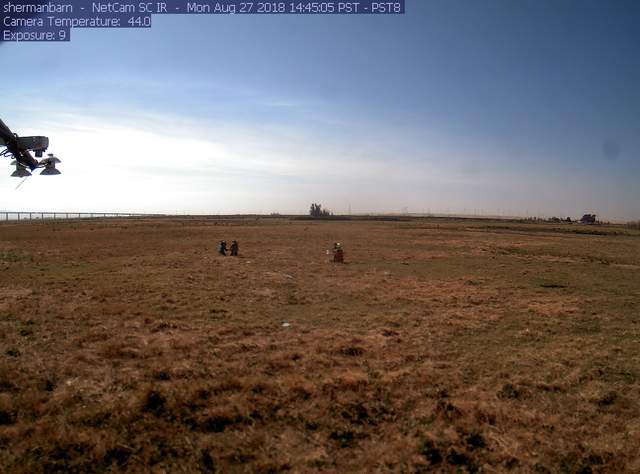
Soil sampling
shermanbarn_2018_08_27_144505.jpg ( 2018-08-27 14:50:00 ) Full size: 1296x960
Soil sampling
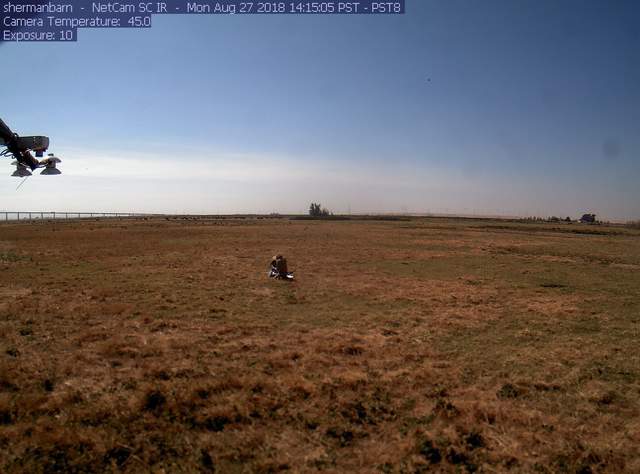
Soil sampling
shermanbarn_2018_08_27_141505.jpg ( 2018-08-27 14:19:52 ) Full size: 1296x960
Soil sampling

Graphs display:
3 sets found

4 SB_flux graphs found

Explore the graph:LI-7500 CO2 and H2O in a new window

Explore the graph:Wind in a new window

Explore the graph:Counts in a new window

Explore the graph:LI7700 CH4 and RSSI in a new window

15 SB_met graphs found

Explore the graph:Soil Heat Flux in a new window

Explore the graph:Temperature in a new window

Explore the graph:Air Pressure and RH in a new window

Explore the graph:Soil Moisture in a new window

Explore the graph:PAR in a new window

Explore the graph:NDVI channels in a new window

Explore the graph:PRI channels in a new window

Explore the graph:Solar Radiation in a new window

Explore the graph:SRS NDVI and PRI in a new window

Explore the graph:Thermocouple Set A in a new window

Explore the graph:Thermocouple Set B in a new window

Explore the graph:Thermocouple Set C in a new window

Explore the graph:Battery Voltage in a new window

Explore the graph:Water Level in a new window

Explore the graph:Counts from Motion Sensor in a new window

Can't check TATWBABCSB_cam