Field Notes

<--2018-06-28 13:05:00 | 2018-07-26 15:20:00-->
Other sites visited today: Sherman Barn
Phenocam link: Searching...

Sherman Wetland: 2018-07-11 13:05:00 (DOY 192)
Author: Daphne Szutu
Others: Joe, Kyle

Summary: Regular data download/cleaning, added staff gauge, transplanted tule close to LGR

2018-07-11
Sherman Wetland

We arrived at 13:05. It was warm, breezy, and sunny.

I collected met, camera, USB GHG, and miniDOT data. I didn’t have the usual USB and camera card to swap out, so I just transferred the files to the laptop and re-used the same USB and camera card. I double-checked that the clocks were synced, the 7700 was connected, and the USB was logging.

Joe added a staff gauge on the solar panel scaffolding facing the long section of the boardwalk. The water level was 47cm.

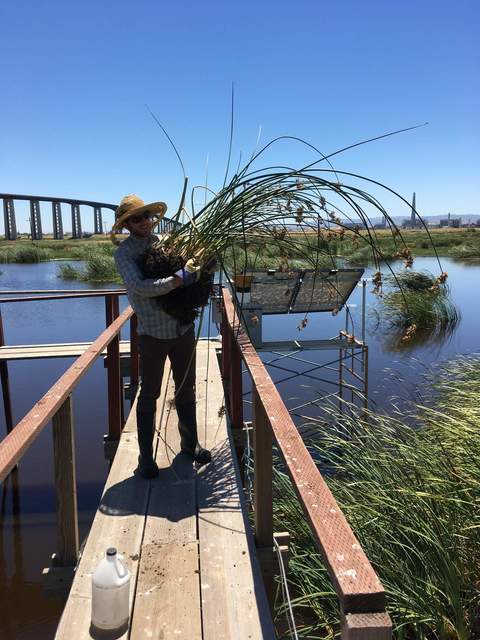
Kyle transplanted some tules to the SE corner off of Patty’s patio/LGR. The tules came from the midway point of the long section of boardwalk, just off the N edge. We transplanted these tules so they are close enough to the LGR for leaf-level isotopic analysis with the LI-6400.

LI-7500 readings:
CO2 403ppm
H2O 700ppm
T 28.0C
P 101.1kPa
SS 103-->105

LI7700 readings
CH4 2.05ppm
RSSI 35ppm --> 76ppm after cleaning

We left at 13:35.

1 photos found

Kyle relocating some tules closer to the tower for future isotope chamber work.
20180711SW_KyleTuleRelocation.jpg ( 2018-07-11 13:14:54 ) Full size: 1440x1920
Kyle relocating some tules closer to the tower for future isotope chamber work.

Graphs display:
7 sets found

Can't check MBWPEESWGT_mixed
Can't check MBEEWPSWEPGT_cam
16 SW_met graphs found

Explore the graph:Temperatures in a new window

Explore the graph:Water Temperature Profile A in a new window

Explore the graph:Water Temperature Profile B in a new window

Explore the graph:Soil Temperature Profile C2 in a new window

Explore the graph:Soil Heat Flux in a new window

Explore the graph:Four channel Radiometer in a new window

Explore the graph:Sherman Wetland PAR in a new window

Explore the graph:PRI Channels in a new window

Explore the graph:NDVI Channels in a new window

Explore the graph:Water level and Rain in a new window

Explore the graph:Dissolved CO2 in a new window

Explore the graph:Air Pressure in a new window

Explore the graph:Battery Voltage and RH in a new window

Explore the graph:Soil Temperature Profile C1 in a new window

Explore the graph:SRS NDVI and PRI in a new window

Explore the graph:SW miniDOT Dissolved Oxygen in a new window

4 SW_flux graphs found

Explore the graph:CO2 and H2O in a new window

Explore the graph:Wind in a new window

Explore the graph:Methane in a new window

Explore the graph:Data Counts in a new window

Can't check MBSWEEWPBCBA
Can't check SW_Temp
14 SW_Temp graphs found

Explore the graph:Temperatures in a new window

Explore the graph:CO2 and H2O in a new window

Explore the graph:Wind in a new window

Explore the graph:Methane in a new window

Explore the graph:Data Counts in a new window

Explore the graph:Temperature Profile A in a new window

Explore the graph:Temperature Profile B in a new window

Explore the graph:Temperature Profile C in a new window

Explore the graph:Soil Heat Flux in a new window

Explore the graph:Four-channel radiometer in a new window

Explore the graph:NDVI Channels in a new window

Explore the graph:PAR in a new window

Explore the graph:Air Pressure and Water Level in a new window

Explore the graph:Air T and RH in a new window

No data found for SW_arable.