
Field Notes
<--2016-04-28 12:50:00 | 2016-05-17 09:15:00-->Other sites visited today: Twitchell Rice | West Pond | East End | Mayberry
Phenocam link: Searching...
Twitchell Alfalfa: 2016-05-12 11:35:00 (DOY 133)
Author: Elke Eichelmann
Others: Kyle Hemes, Tyler, Joe
Summary: Regular data collection; did spectral, soil respiration, and clip plots; started to reorganize the soil sensors
| Arrived at 11:35. Sunny, breezy, mostly clear skies, but some high thin sparse clouds. Joe arrived a little earlier, started to put some of the soil sensors in conduit, also moved the first soil heat flux plate from main tower to radiation and soil CO2 measurement location. Also added one theta probe. But none of these are measured by the program yet. Collected USB GHG data, collected met data from CR1000 (by the GHG tower) directly to the laptop, since we forgot to bring a Compact Flash card to swap, collected camera pictures, collected soil CO2 data, collected radiation CR10X data. Did spectral measurements. Did soil respiration measurements. Took canopy height measurements in cm: 41; 46; 41; 36; 52; 48; 39; 40; 52; 48; Did four clip plots. We did not bring the right size paper bags to do the clip plots, but found four plastic bags that we used instead. Sample No Canopy Height (cm) Fresh Weight (g) LAI (cm2) 1; 42; 211.82; 3582.8; 2; 30; 139.82; 2660.67; 3; 25; 112.03; 1889.19; 4; 41; 182.54; 3496.94; LI7500 readings: CO2 372.91 H2O 733.8 T 19.76 P 101.47 SS 91.69 -> 95.73 after cleaning Left at 13:00 |
Veg Height (cm): Tape measure from ground to top of plant
41, 46, 41, 36, 52, 48, 39, 40, 52, 48, avg = 44.3, stdev = 5.64
2 photos found
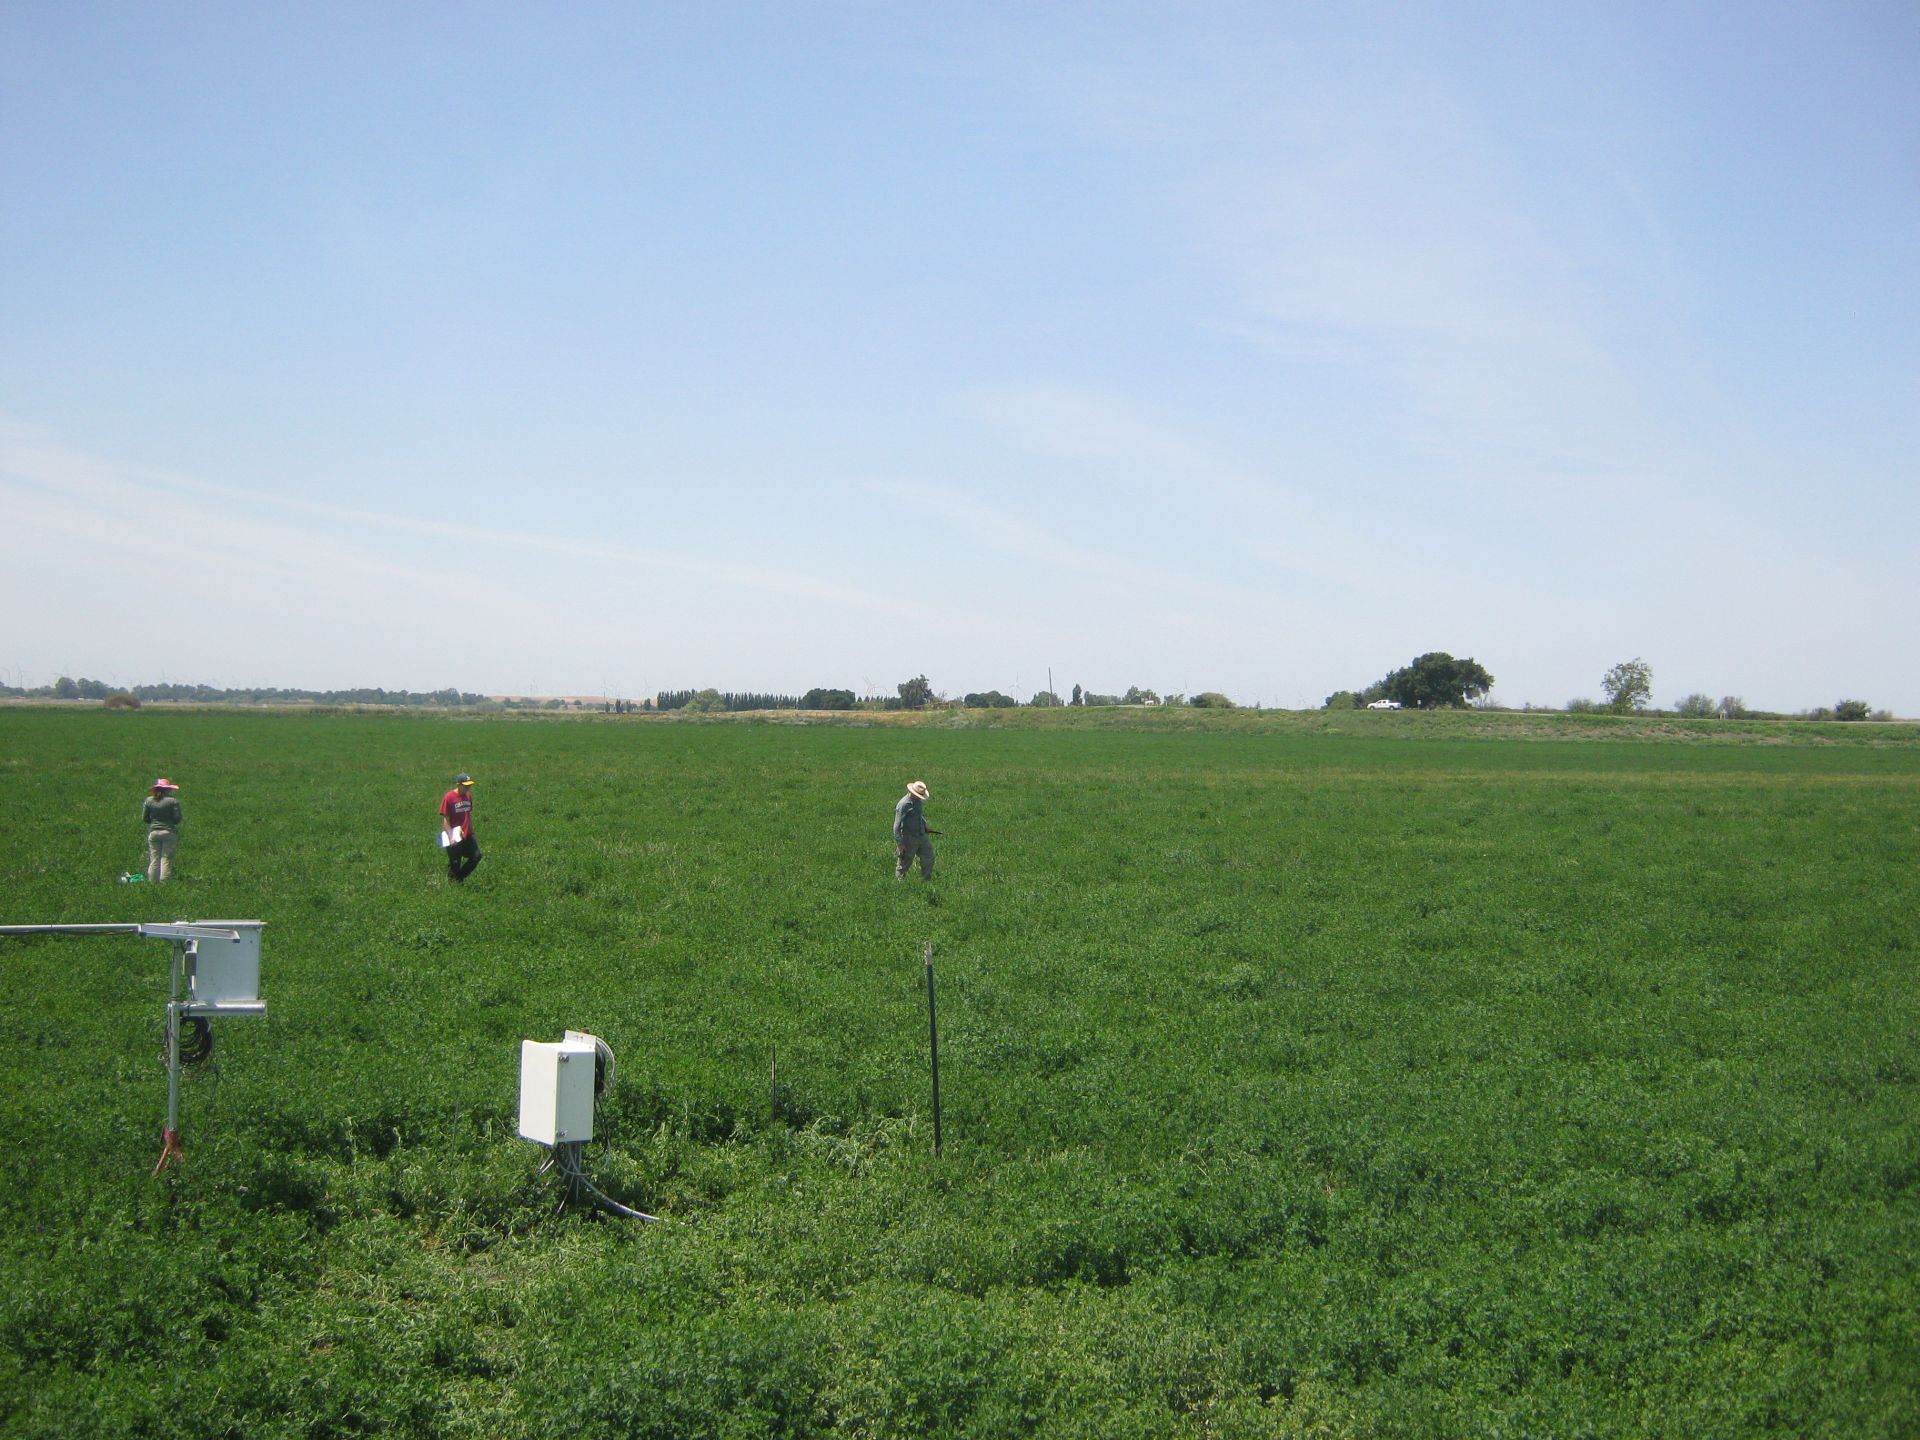
TA_autocam_20160512_1145.jpg ( 2016-05-12 11:45:02 ) Full size: 1920x1440
Elke, Tyler and Kyle on site
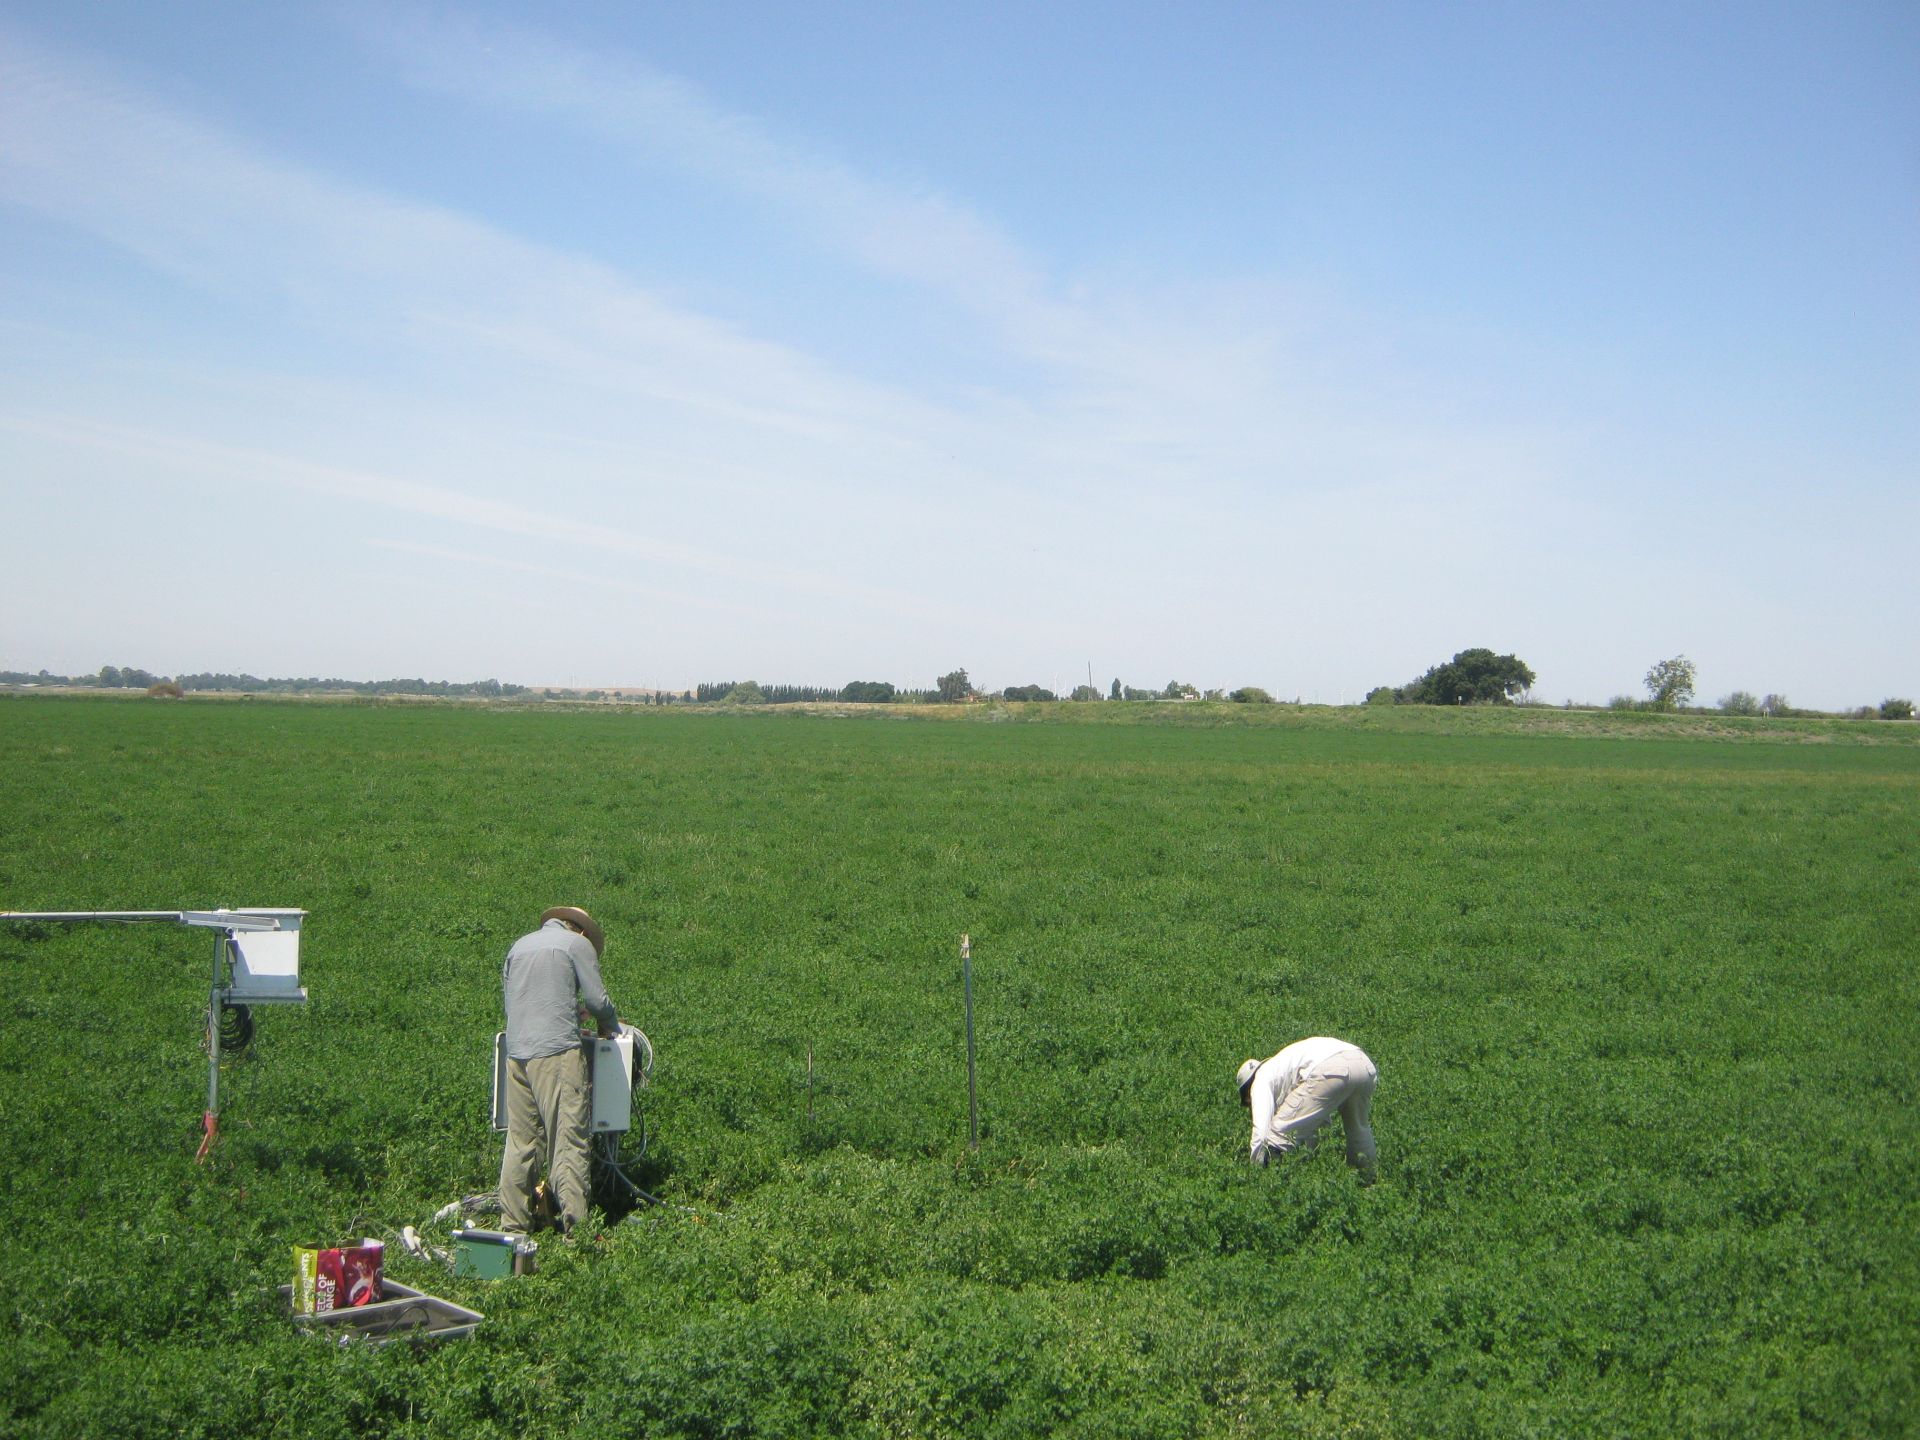
TA_autocam_20160512_1045.jpg ( 2016-05-12 10:45:02 ) Full size: 1920x1440
Kyle and Joe on site
7 sets found
Can't check TA_met
11 TA_met graphs found
Can't check TA_rad
3 TA_rad graphs found
Can't check TA_flux
5 TA_flux graphs found
Can't check TA_soilco2
7 TA_soilco2 graphs found
No data found for TA_arable.
1 TA_cam graphs found
Can't check TATWBABCSB_cam