Field Notes
<--2016-01-28 00:00:00 | 2016-02-25 12:30:00-->Other sites visited today: Mayberry | Twitchell Rice | East End | West Pond
Phenocam link: Searching...
Twitchell Alfalfa: 2016-02-11 11:55:00 (DOY 42)
Author: Patty Oikawa
Others: Kyle Hemes
Summary: Swapped 7500, swapped profile A 8cm probe, LI6400 needs calibration
| Arrived at 11:55am. It was hazy, warm with no breeze. There were sheep in the field south to us and sheep fencing was still around the tower area but was collapsed in one spot. There were no sheep in our field. The alfalfa is definitely starting to grow now and we should do clip plots next time. It was too hazy to do spectral. Kyle did soil respiration, and it kept giving a warning “IRGAS not ready†but we took measurements anyway and they looked normal (around 5 umol m-2 s-1). The LI6400 file was TA_20160211b. I need to calibrate the 6400 before next field trip. The profile A 8cm probe was reading low so I swapped it (old probe sn Y0710013 was replaced with sn F4960018). After the swap it was reading more realistic numbers (went from 200 to 500 mV). We also swapped the LI7500 (old 7500 sn 1594 was replaced with sn 75H-2180). All looked good after the swap. I downloaded data and noticed that the camera box had a lot of water condensed on the window which probably obscured some photos. I cleaned the window. Kyle cleaned the solar panels and measure veg height. 7500 readings: CO2 = 440 ppm (445 after swap) H2O = 652.3 mmol m-3 (609 after swap) signal strength = 101% (97 after swap) t = 20.15 C (19.44 after swap) p = 101.2 (102.18 after swap) sos = 343m s-1 (344 after swap) |
Veg Height (cm): Tape measure from ground to top of plant
17, 16, 7, 12, 10, 11, 11, 12, 6, 6, 16, 9, 12, 11, 15, 13, 13, 10, 11, 7, avg = 11.3, stdev = 3.24
3 photos found

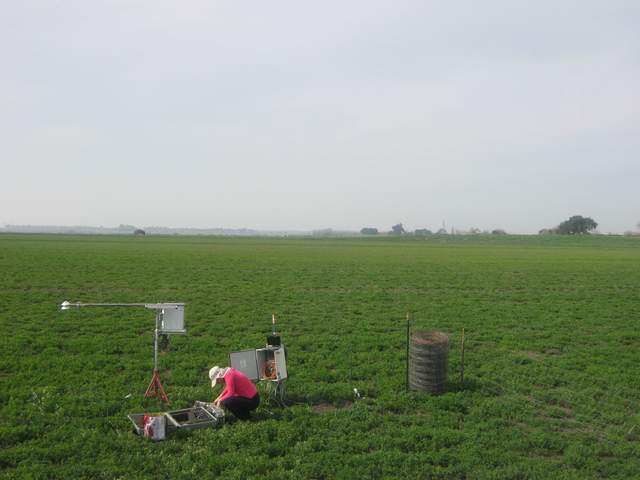
TA_autocam_20160211_1215.jpg ( 2016-02-11 12:15:02 ) Full size: 1920x1440
Patty on site

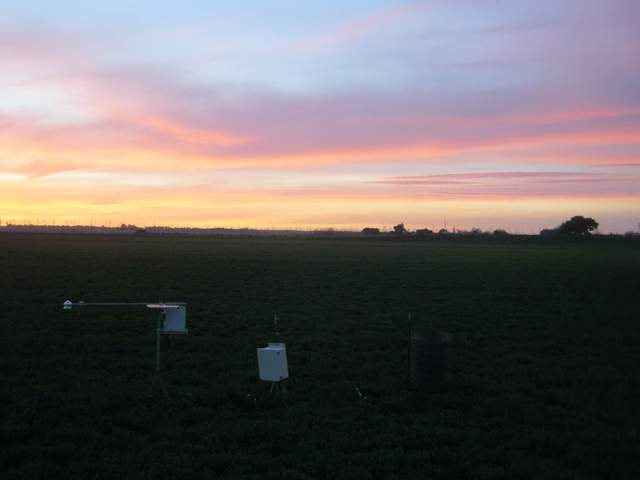
TA_autocam_20160212_1745.jpg ( 2016-02-12 17:45:02 ) Full size: 1920x1440
Nice sunset

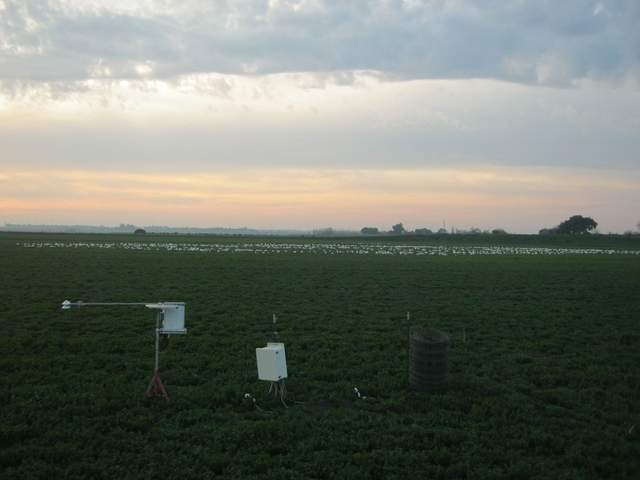
TA_autocam_20160211_1715.jpg ( 2016-02-11 17:15:03 ) Full size: 1920x1440
Geese on the field
7 sets found
Can't check TA_met
11 TA_met graphs found
Can't check TA_rad
3 TA_rad graphs found
Can't check TA_flux
5 TA_flux graphs found
Can't check TA_soilco2
7 TA_soilco2 graphs found
No data found for TA_arable.
1 TA_cam graphs found
Can't check TATWBABCSB_cam

