
Field Notes
<--2014-05-21 09:40:00 | 2014-06-05 10:30:00-->Other sites visited today: Sherman Island | Twitchell Rice | East End | West Pond | Twitchell Alfalfa
Phenocam link: Searching...
Mayberry: 2014-05-29 11:30:00 (DOY 149)
Author: Cove Sturtevant
Others: Patty, Madeline
Summary: Moved portable tower to new HighVeg site. All well at permanent and portable towers.
| Mayberry 2014-05-29 Portable Tower Patty, Madeline, and I arrived at the high veg portable tower site at about 11:30 PDT. It was sunny and quickly becoming hot, with a decent breeze. After perusing the portable tower data from the high veg site, there was some question of whether the water in the early part of the footprint was contributing too heavily to the flux and therefore making this site less than ideal for high veg. In fact, the uptake from this site was lower than the permanent tower site. So, we moved the tower to a new high veg site on the main N-S berm just east of the original high veg site. This new site is 100% veg from 0-75m in the footprint, then a channel, then high veg again. Since the greatest potential for footprint source error (water vs. veg) lies in the early part of the footprint, this new site will remove that uncertainty. Downloaded the data. I placed a stake with a flag on it in line with the front of the truck for subsequent revisits. The truck was facing to the south. The truck is also tilted a bit at the new HighVeg site so we had to play with the tripod legs to level the sonic. Took GPS reading of new HighVeg site: 38° 2.982’ N, 121° 46.139’ W Sonic orientation: 311° N magnetic. I noticed from processing the data that the clock on the portable tower is one hour ahead of the permanent tower. Since we used the Ameriflux 7550 on the permanent tower, we should check both next time to see which one is actually off. CO2: 400 ppm (same after cleaning) H2O: 420 mmol m-3 (same after cleaning) signal strength = 90.7% (90.5% after cleaning) t: 27.5 °C p = 101.3 kPa sos = 346.4 m s-1 CH4: 1.95 ppm (2.2 ppm at new HighVeg spot) RSSI: 47% (89% after cleaning) Cleaned solar panel. Took photos of footprint. Permanent Tower Site is nice and green. All was well. Dropped off PVC tubes. Downloaded data. Patty took spectral measurements from tower. 7500 readings: CO2: 393 ppm (same after cleaning) H2O: 400 mmol m-3 (same after cleaning) signal strength = 94.99% (95.7% after cleaning) t: 26.2 °C p = 101.3 kPa sos = 348 m s-1 Current 7700 readings: CH4 = 2.0 ppm (2.2 after cleaning) RSSI = 34% (74% after cleaning) Reservoir was full. Met looked good. Cleaned radiation sensors. |
4 photos found

20140530MB_HighVeg2_270.JPG ( 2014-05-29 12:10:02 ) Full size: 640x478
View from new High Veg site
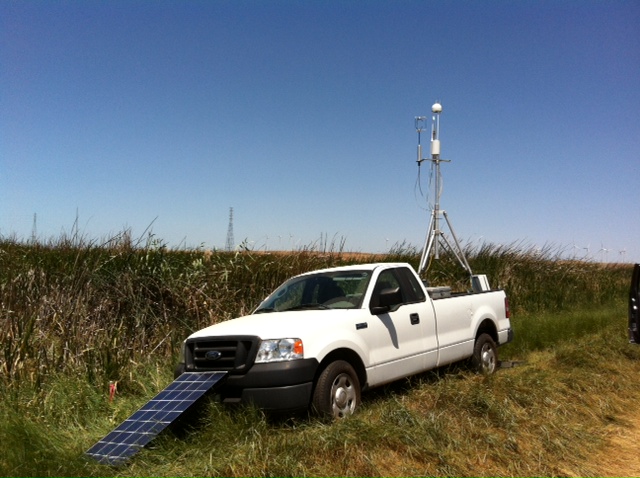
20140530MB_HighVeg2.JPG ( 2014-05-29 12:13:35 ) Full size: 640x478
Portable tower set up at new high veg site

20140530MB_HighVeg2_315.JPG ( 2014-05-29 12:10:10 ) Full size: 640x478
View from new High Veg site

MB_autocam_20140530_2015.jpg ( 2014-05-30 20:15:02 ) Full size: 1920x1440
Nice sunset
11 sets found
7 MB_flux graphs found
No data found for MB_met.
28 MB_tule graphs found
Can't check MBWPEESWGT_mixed
1 MB_cam graphs found
Can't check MBEEWPSWEPGT_cam
Can't check SIMBTWEE_met
No data found for MB_minidot.
Can't check MBSWEEWPBCBA
1 MB_processed graphs found
Can't check MB_fd
1 MB_fd graphs found