Field Notes
<--2014-05-13 14:00:00 | 2014-05-29 11:30:00-->Other sites visited today: Sherman Island | Twitchell Alfalfa | West Pond | East End | Twitchell Rice
Phenocam link: Searching...
Mayberry: 2014-05-21 09:40:00 (DOY 141)
Author: Sara Knox
Others: Joe and Madeleine
Summary: Didn’t move portable tower (still at south high veg site). Fixed boardwalk. Replaced HMP45 fan. Downloaded portable tower and permanent tower data.
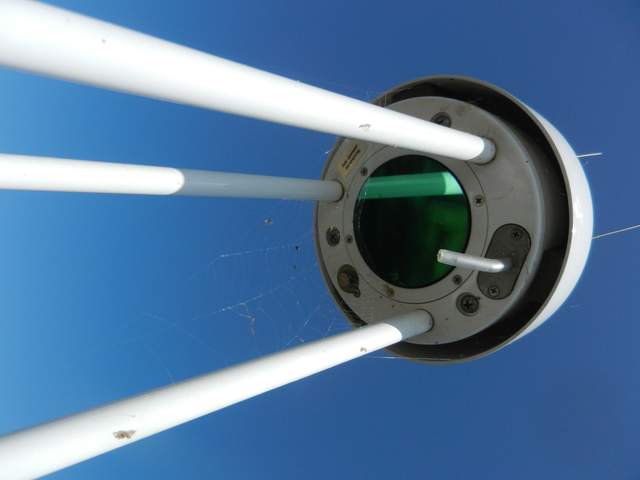
| Mayberry 2014-05-21 Portable Tower Joe, Madeleine and I arrived at the high veg site (south) portable tower location at about 9:40 PDT. It was sunny and hot with no breeze. The RSSI was very low (22.5) since there was a spider web in the path of the 7700. Joe chased several spiders out of its hat. We downloaded the data to see how long the RSSI had been that low to determine whether or not it was worth moving the tower. We found that the RSSI had dropped below 10 three days after the tower had been moved to that location (i.e. by May 16th). Since there were only three days of good data at that location we decided not to move the tower this week. We’ll try to move it to the north location early next week. We downloaded the flux data. Joe was going to download the battery/solar panel data but the data logger box was full of ants so we left the box open so that the ants could find a new home. We came back after visiting the permanent tower to collect the data. There were still ants in the box, but fewer than before. reservoir was full. CO2: 403 ppm H2O: 626 mmol m-3 signal strength = 90.31% (91.21% after cleaning) t: 21.01 °C p: 101.39 kPa sos: 343.85 m s-1 CH4: 1.95 ppm (1.91 after cleaning) RSSI: 22.5% (82% after cleaning) Permanent Tower The site continues to green up but there seems to be more thatch than last year. Joe fixed up the boardwalk. It seems much sturdier now! I downloaded the flux and met data and Madeleine cleaned the sensors. He also put a retaining clip on the camera and put a new hose clamp on the post. Things seemed to be working properly. Met looked fine. Reservoir was full. 7500 readings: CO2: 407.3 ppm H2O: 632 mmol m-3 signal strength = 93.23% (95.71% after cleaning) t: 21.32°C p: 101.37 kPa sos: 344.4 m s-1 Current 7700 readings: CH4 = 1.99 ppm RSSI = 39% (62.4% after cleaning) |
1 photos found

20140521MP_7700SpiderWeb.jpg ( 2014-05-21 09:56:14 ) Full size: 1920x1440
Spider webs in 7700 path
11 sets found
7 MB_flux graphs found
No data found for MB_met.
28 MB_tule graphs found
Can't check MBWPEESWGT_mixed
1 MB_cam graphs found
Can't check MBEEWPSWEPGT_cam
Can't check SIMBTWEE_met
No data found for MB_minidot.
Can't check MBSWEEWPBCBA
1 MB_processed graphs found
Can't check MB_fd
1 MB_fd graphs found

