
Field Notes
<--2014-04-22 05:45:00 | 2014-05-22 05:30:00-->Phenocam link: Searching...
Tonzi: 2014-05-08 05:50:00 (DOY 128)
Author: Siyan Ma
Others:
Summary: Predawn water potential, reinstalled tram, Trouble connecting to data loggers at Vaira, no moisture point data, standard fieldwork.
|
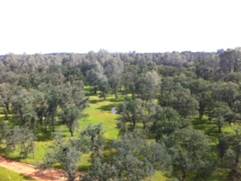
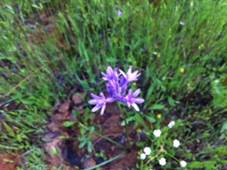
When: Date: 5/8/2014 , Day: 128 , Watch Time: 5:50 am . Where: Tonzi/Vaira Ranch Who: Siyan Weather: Cloudy in the early morning; sunny after 9:00am; Dew on the grasses Phenology: Grass at filling stage, still green; a lot of wild oat, ~70 cm tall at least
Summary
Vaira_Grass Site
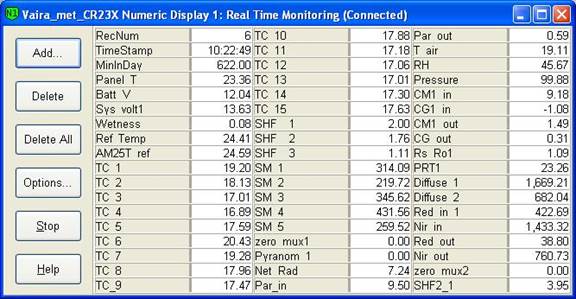 
Tonzi_Tower Site
Is the pump running‌ YES! before zero 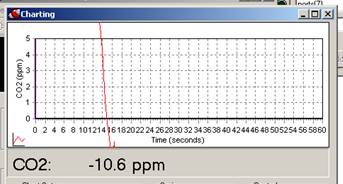 after zero 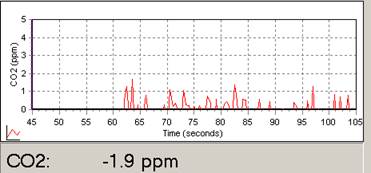 before span 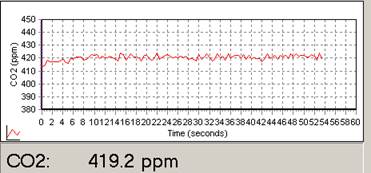 After span 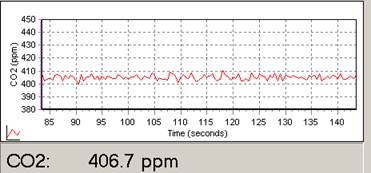 9. closed gate and set up fence. YES! Toniz_Floor Site
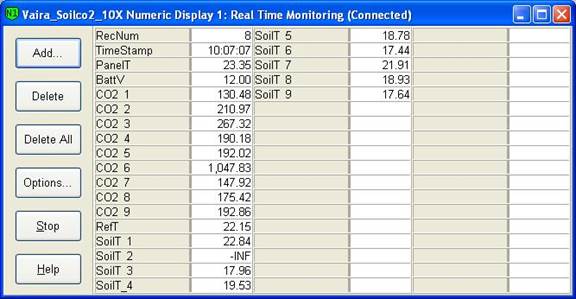
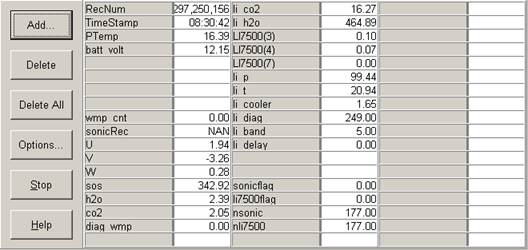
CR23X3 – floor-Met CR23X6 – tower-Met CR10X2 – floor-Met Soil CO2 profile: CR23X5 – soil CO2 profile 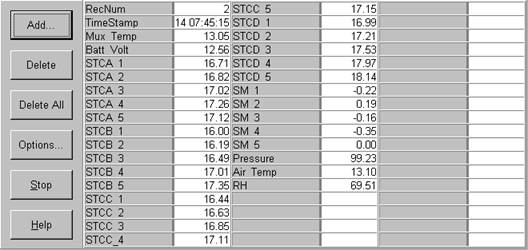 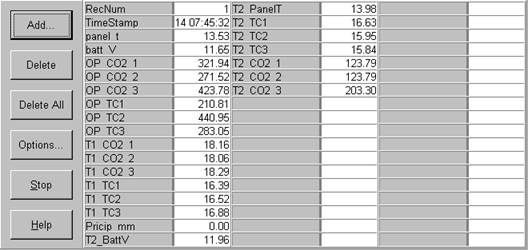 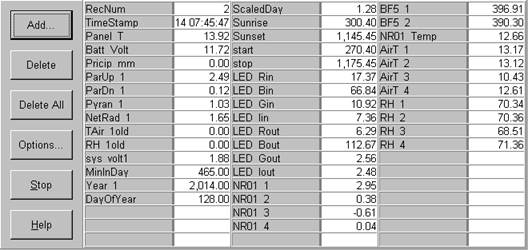 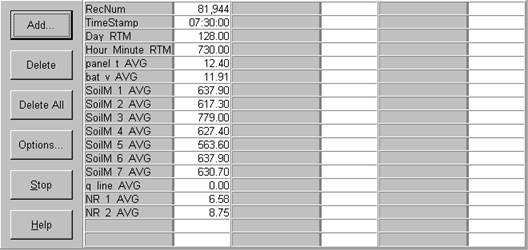
|
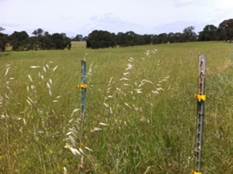
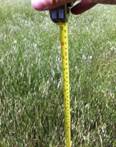
Veg Height (cm): Tape measure from ground to top of plant
37, 33, 30, 40, 20, 55, 46, 30, 38, 70, avg = 39.9, stdev = 14.23
Field Data
CO2 Profile Tanks
| Date | Tank | Pressure (psi) | ppm |
|---|---|---|---|
| 2014-05-08 | CO2 | 1800 | 402.68 |
| 2014-05-08 | N2 | 500 | 0 |
Well Depth
| Date | Location | Depth (feet) |
|---|---|---|
| 2014-05-08 | TZ_floor | 29.8 |
| 2014-05-08 | TZ_road | 37.4 |
| 2014-05-08 | TZ_tower | 38 |
No TZ Moisture Point data found
No VR Moisture Point data found
Grass Height TZ 10
| Date | Height reps (cm) | Location | Average | Samp | STDEV | |||||||||
|---|---|---|---|---|---|---|---|---|---|---|---|---|---|---|
| 2014-05-08 | 37 | 33 | 30 | 40 | 20 | 55 | 46 | 30 | 38 | 70 | GH_ALL | 39.9 | 10 | 13.5 |
Grass Height VR 6
| Date | Height reps (cm) | Location | Average | Samp | STDEV | |||||
|---|---|---|---|---|---|---|---|---|---|---|
| 2014-05-08 | 28 | 22 | 26 | 35 | GH_CLOVER | 27.75 | 4 | 4.71 | ||
| 2014-05-08 | 120 | 100 | 80 | 60 | 130 | 80 | GH_GRASS | 95 | 6 | 24.32 |
Tree DBH
| Date | Tag# | Reading (mm) |
|---|---|---|
| 2014-05-08 | 1 | 25.5 |
| 2014-05-08 | 2 | 21.2 |
| 2014-05-08 | 3 | 23.7 |
| 2014-05-08 | 5 | 26.2 |
| 2014-05-08 | 7 | 21.9 |
| 2014-05-08 | 72 | 18.4 |
| 2014-05-08 | 79 | 23.1 |
| 2014-05-08 | 8 | 12.5 |
Water Potential - mode: raw
| Time | Species | Tree | readings (bar) | ||||
|---|---|---|---|---|---|---|---|
| 2014-05-08 05:58:00 | OAK | 102 | -3 | -3 | -4 | ||
| 2014-05-08 05:58:00 | OAK | 35 | -3.5 | -3 | -3 | ||
| 2014-05-08 05:58:00 | OAK | 92 | -5 | -3 | -4 | ||
| 2014-05-08 06:20:00 | PINE | OLD | -6 | -12 | -8 | ||
| 2014-05-08 06:20:00 | PINE | YNG | -7 | -2 | -5 | -11 | -15 |
| 2014-05-08 12:28:00 | OAK | 102 | -12 | -21 | -15 | ||
| 2014-05-08 12:28:00 | OAK | 35 | -22 | -17 | -22 | ||
| 2014-05-08 12:28:00 | OAK | 92 | -18 | -25 | -30 | ||
| 2014-05-08 12:54:00 | PINE | OLD | -25 | -18 | -181 | ||
| 2014-05-08 12:54:00 | PINE | YNG | -6 | -5 | -9 | ||
No TZ Grass Biomass data found
No TZ OakLeaves Biomass data found
No TZ PineNeedles Biomass data found
0 photos found
16 sets found
No data found for TZ_Fenergy.
11 TZ_tmet graphs found
11 TZ_soilco2 graphs found
Can't check TZ_mixed
3 TZ_mixed graphs found
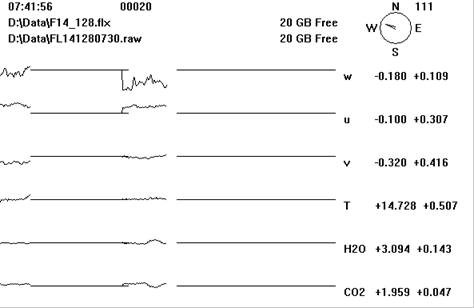
1 TZ_fflux graphs found
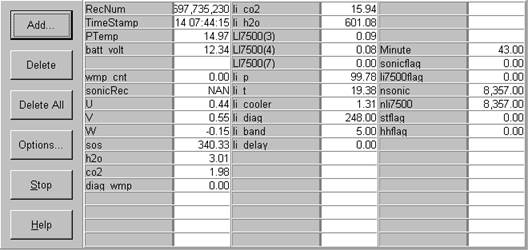
8 TZ_fmet graphs found
1 TZ_tram graphs found
3 TZ_co2prof graphs found
No data found for TZ_irt.
No data found for TZ_windprof.
1 TZ_tflux graphs found
2 TZ_sm graphs found
Can't check TZ_met
1 TZ_met graphs found
Can't check TZVR_mixed
8 TZ_osu graphs found
No data found for TZ_fd.
Tonzi Z-cam data