
Field Notes
<--2014-05-08 05:50:00 | 2014-06-11 05:00:00-->Other sites visited today: Vaira
Phenocam link: Searching...
Tonzi: 2014-05-22 05:30:00 (DOY 142)
Author: Joe Verfaillie
Others:
Summary: Predawn water potential, cleaned co2 profile cell, tram brought in for repair, z-cams serviced, no Tower phenocam images, Floor HMP45 fan replaced.
| Tonzi 2014/05/22 I arrived about 5:30am PDT for predawn water potential. Sunrise was about 5:47PDT according to NOAA, so it was not pitch dark. There was enough light to see by but no direct sun yet. There are lots of flowers everywhere, but the ground is pretty dry and the grass is only still a little green in the low areas. Tonzi’s pond still only looks about half full. There was heavy dew on the grass and the zcam windows were wet – maybe a little drizzle over night. After water potential I checked on the tower. I could not find anything wrong with the LED sensor or the 4-chan radiation sensor that would cause the offset I see in the LED reflected blue channel or the SW-in channel. There was condensation in the diffuse PAR sensor. I replaced the desiccant pack inside the housing. The tower did not collect Phenocam photos because the ftproot folder had been removed from the C drive. I fixed this and it was getting photos again. The Phenocam clock was okay. I checked the Tower sonic heading (see photo). Magnetic north -72 degrees is 302 True. The Floor sonic heading was magnetic north +16 degrees = 30 degrees True. These match Siyan’s iPhone readings of 308 and 25. I went to Vaira about 8am. I serviced the z-cams. Test photos at 1: 7:04, 2: 7:13, 3: 7:19 The tram was stuck mid-track again. I restarted it, but discovered a short circuit in the box and (independently?) the south motor seemed to lock up – maybe it just needs some grease. I brought the tram in for maintenance. I forgot to bring the well senor, so no well data. I could not find the trees that Siyan does DBH on, so no DBH data. I did the Moisture Point measurements. A number of the probes seem to be giving bad readings due to loose connections. We might replace the meter cable or buy some conductive grease to improve the connections. I fixed the Loggernet display for the Soil CO2 system on the floor computer – the labels now match the data. I replaced the fan on the floor HMP45 that died several weeks ago. The CO2 Profile readings were off scale. I cleaned the sample cell of the LI-820. There were a few grains of dust visible in the cell. After cleaning, I calibrated the system. Last cal was 2014-05-08. Zero was off more that -58ppm (railed). Span was off only by about 3ppm. I did midday water potential before I left. |
Field Data
CO2 Profile Tanks
| Date | Tank | Pressure (psi) | ppm |
|---|---|---|---|
| 2014-05-22 | CO2 | 1700 | 402.68 |
| 2014-05-22 | N2 | 500 | 0 |
No TZ Well data found
mode = both
Moisture Point Probes TZ
Array
(
[0] => Tower_1
[1] => Floor_South_1
[2] => Floor_East_1
[3] => Floor_West_1
[4] => SoilCO2_1
[5] => Soil_Transect_3_1
[6] => Soil_Transect_2_1
[7] => Soil_Transect_1_1
[8] => SoilCO2_West_A_1
[9] => SoilCO2_West_B_1
[10] => SoilCO2_West_C_1
[11] => Tower_2
[12] => Floor_South_2
[13] => Floor_East_2
[14] => Floor_West_2
[15] => SoilCO2_2
[16] => Soil_Transect_4_2
[17] => Soil_Transect_3_2
[18] => Soil_Transect_2_2
[19] => Soil_Transect_1_2
[20] => SoilCO2_West_A_2
[21] => SoilCO2_West_B_2
[22] => SoilCO2_West_C_2
[23] => Tower_3
[24] => Floor_South_3
[25] => Floor_East_3
[26] => Floor_West_3
[27] => SoilCO2_3
[28] => Soil_Transect_4_3
[29] => Soil_Transect_3_3
[30] => Soil_Transect_2_3
[31] => Soil_Transect_1_3
[32] => SoilCO2_West_A_3
[33] => SoilCO2_West_B_3
[34] => Tower_4
[35] => Floor_South_4
[36] => Floor_East_4
[37] => Floor_West_4
[38] => SoilCO2_4
[39] => Soil_Transect_4_4
[40] => Soil_Transect_3_4
[41] => Soil_Transect_2_4
[42] => Soil_Transect_1_4
[43] => SoilCO2_West_A_4
[44] => SoilCO2_West_B_4
[45] => SoilCO2_West_C_4
[46] => SoilCO2_West_C_3
[47] => Soil_Transect_4_1
)
| Date | DOY | Rep | Depth | Tower_1 |
Floor_South_1 |
Floor_East_1 |
Floor_West_1 |
SoilCO2_1 |
Soil_Transect_3_1 |
Soil_Transect_2_1 |
Soil_Transect_1_1 |
SoilCO2_West_A_1 |
SoilCO2_West_B_1 |
SoilCO2_West_C_1 |
Tower_2 |
Floor_South_2 |
Floor_East_2 |
Floor_West_2 |
SoilCO2_2 |
Soil_Transect_4_2 |
Soil_Transect_3_2 |
Soil_Transect_2_2 |
Soil_Transect_1_2 |
SoilCO2_West_A_2 |
SoilCO2_West_B_2 |
SoilCO2_West_C_2 |
Tower_3 |
Floor_South_3 |
Floor_East_3 |
Floor_West_3 |
SoilCO2_3 |
Soil_Transect_4_3 |
Soil_Transect_3_3 |
Soil_Transect_2_3 |
Soil_Transect_1_3 |
SoilCO2_West_A_3 |
SoilCO2_West_B_3 |
Tower_4 |
Floor_South_4 |
Floor_East_4 |
Floor_West_4 |
SoilCO2_4 |
Soil_Transect_4_4 |
Soil_Transect_3_4 |
Soil_Transect_2_4 |
Soil_Transect_1_4 |
SoilCO2_West_A_4 |
SoilCO2_West_B_4 |
SoilCO2_West_C_4 |
SoilCO2_West_C_3 |
Soil_Transect_4_1 |
Avg | Spacial Count |
Measurement Count |
|---|---|---|---|---|---|---|---|---|---|---|---|---|---|---|---|---|---|---|---|---|---|---|---|---|---|---|---|---|---|---|---|---|---|---|---|---|---|---|---|---|---|---|---|---|---|---|---|---|---|---|---|---|---|---|
| 2014-05-22 | 142 | 0 | nan | 13 | 6.2 | 39.9 | 11.1 | 8 | 3.9 | 2.1 | 5.6 | 10.1 | 6.8 | 25.6 | 10.9 | 16.4 | 22.5 | 13.3 | 9 | 10.9 | 13.9 | 15.2 | 6.9 | 9.7 | 0.3 | 18.2 | 21.5 | 15.1 | 24.3 | 19 | 9 | 12.3 | 39.6 | 20.4 | 17.6 | 17.6 | 18.4 | 41.4 | 13.6 | 19.9 | 11.1 | 11.1 | 13.9 | 41.1 | 35.4 | 14.2 | 31.4 | 25.4 | 15.9 | |||||
| 2014-05-22 | 142 | 1 | nan | 13 | 7.4 | 39.9 | 11.1 | 7.1 | 6.5 | 1.2 | 6.2 | 10.9 | 5.3 | 11.5 | 16.4 | 33.8 | 13 | 10 | 11.2 | 16.1 | 15.5 | 6.3 | 7.8 | 6.6 | 16.7 | 20.9 | 15.6 | 17 | 20.1 | 8.7 | 11.7 | 11.2 | 20.9 | 17.3 | 18.7 | 21.8 | 41.4 | 12.2 | 24.2 | 11.1 | 11.1 | 13.9 | 31.7 | 45.1 | 14.2 | 31.1 | 27.1 | 17.6 | ||||||
| 2014-05-22 | 142 | 2 | nan | 5.3 | 11.8 | 15.8 | 11.7 | 13.9 | 25.9 | 18.2 | 3.9 | |||||||||||||||||||||||||||||||||||||||||||
| 2014-05-22 | 142 | Avg | 0-15cm | 0 | 0 | |||||||||||||||||||||||||||||||||||||||||||||||||
| 2014-05-22 | 142 | Avg | 15-30cm | 0 | 0 | |||||||||||||||||||||||||||||||||||||||||||||||||
| 2014-05-22 | 142 | Avg | 30-45cm | 0 | 0 | |||||||||||||||||||||||||||||||||||||||||||||||||
| 2014-05-22 | 142 | Avg | 45-60cm | 0 | 0 |
mode = both
Moisture Point Probes VR
Array
(
[0] => Solar_Panels_1
[1] => Flux_Tower_1
[2] => Gate_1
[3] => Biomass_Cage_1
[4] => Solar_Panels_2
[5] => Flux_Tower_2
[6] => Gate_2
[7] => Biomass_Cage_2
[8] => Solar_Panels_3
[9] => Flux_Tower_3
[10] => Gate_3
[11] => Biomass_Cage_3
[12] => Solar_Panels_4
[13] => Flux_Tower_4
[14] => Gate_4
[15] => Biomass_Cage_4
)
| Date | DOY | Rep | Depth | Solar_Panels_1 |
Flux_Tower_1 |
Gate_1 |
Biomass_Cage_1 |
Solar_Panels_2 |
Flux_Tower_2 |
Gate_2 |
Biomass_Cage_2 |
Solar_Panels_3 |
Flux_Tower_3 |
Gate_3 |
Biomass_Cage_3 |
Solar_Panels_4 |
Flux_Tower_4 |
Gate_4 |
Biomass_Cage_4 |
Avg | Spacial Count |
Measurement Count |
|---|---|---|---|---|---|---|---|---|---|---|---|---|---|---|---|---|---|---|---|---|---|---|
| 2014-05-22 | 142 | 0 | nan | 3.6 | 5.6 | 10.3 | 0.3 | 7.8 | 10.3 | 12.7 | 4.5 | 2.3 | 14.3 | 15.9 | 11.7 | 13.9 | 26.8 | 11.6 | 14.2 | |||
| 2014-05-22 | 142 | 1 | nan | 4.7 | 5.3 | 8.3 | 0.1 | 7.8 | 10.3 | 8.7 | 4.8 | 2 | 13.7 | 12 | 11.2 | 13 | 26.2 | 11.3 | 13.9 | |||
| 2014-05-22 | 142 | Avg | 0-15cm | 0 | 0 | |||||||||||||||||
| 2014-05-22 | 142 | Avg | 15-30cm | 0 | 0 | |||||||||||||||||
| 2014-05-22 | 142 | Avg | 30-45cm | 0 | 0 | |||||||||||||||||
| 2014-05-22 | 142 | Avg | 45-60cm | 0 | 0 |
No TZ grass heigth found
No VR grass heigth found
No TZ Tree DBH found
Water Potential - mode: raw
| Time | Species | Tree | readings (bar) | |||
|---|---|---|---|---|---|---|
| 2014-05-22 05:45:00 | OAK | 102 | -4 | -4 | -5 | |
| 2014-05-22 05:45:00 | OAK | 35 | -8 | -6 | -7 | |
| 2014-05-22 05:45:00 | OAK | 92 | -4.5 | -4.5 | -4.5 | |
| 2014-05-22 06:00:00 | PINE | OLD | -6 | -13 | -8 | -13 |
| 2014-05-22 06:00:00 | PINE | YNG | -4.5 | -8 | -13 | -9 |
| 2014-05-22 12:25:00 | OAK | 102 | -11 | -29 | -27 | |
| 2014-05-22 12:25:00 | OAK | 35 | -24 | -24 | -35 | |
| 2014-05-22 12:25:00 | OAK | 92 | -15 | -26 | -28 | |
| 2014-05-22 12:45:00 | PINE | OLD | -22 | -18 | -18 | |
| 2014-05-22 12:45:00 | PINE | YNG | -12 | -17 | -10 | |
No TZ Grass Biomass data found
Biomass TZ OakLeaves
| Date | rep | AREA (cm2) | LEAFNO (count) | LEAFAREA (cm2) | Green WETWT (g) | Green DRYWT (g) | Brown WETWT (g) | Brown DRYWT (g) | Area/Leaf (cm2/leaf) |
Green WETWT/AREA (g/m2) |
Green DRYWT/AREA (g/m2) |
Brown WETWT/AREA (g/m2) |
Brown DRYWT/AREA (g/m2) |
|---|---|---|---|---|---|---|---|---|---|---|---|---|---|
| 2014-05-22 | 0 | 63 | 213 | 6.27 | 3.38 | 3.38 | 294.37 | 158.69 | 0 | 0 | |||
| 2014-05-22 | 1 | 86 | 159.5 | 3.57 | 1.88 | 1.85 | 223.82 | 117.87 | 0 | 0 | |||
| 2014-05-22 | 2 | 51 | 175.7 | 4.9 | 2.69 | 3.45 | 278.88 | 153.1 | 0 | 0 | |||
| 2014-05-22 | SUM | ||||||||||||
| 2014-05-22 | CNT | 3 | 3 | 3 | 3 | 3 | 3 | 3 | |||||
| 2014-05-22 | AVG | 2.89 | 265.69 | 143.22 |
Biomass TZ PineNeedles
| Date | rep | AREA (cm2) | LEAFNO (count) | LEAFAREA (cm2) | Green WETWT (g) | Green DRYWT (g) | Brown WETWT (g) | Brown DRYWT (g) | Area/Leaf (cm2/leaf) |
Green WETWT/AREA (g/m2) |
Green DRYWT/AREA (g/m2) |
Brown WETWT/AREA (g/m2) |
Brown DRYWT/AREA (g/m2) |
|---|---|---|---|---|---|---|---|---|---|---|---|---|---|
| 2014-05-22 | 0 | 14 | 39.4 | 3.51 | 1.63 | 2.81 | 890.86 | 413.71 | 0 | 0 | |||
| 2014-05-22 | SUM | ||||||||||||
| 2014-05-22 | CNT | 1 | 1 | 1 | 1 | 1 | 1 | 1 | |||||
| 2014-05-22 | AVG | 2.81 | 890.86 | 413.71 |
6 photos found
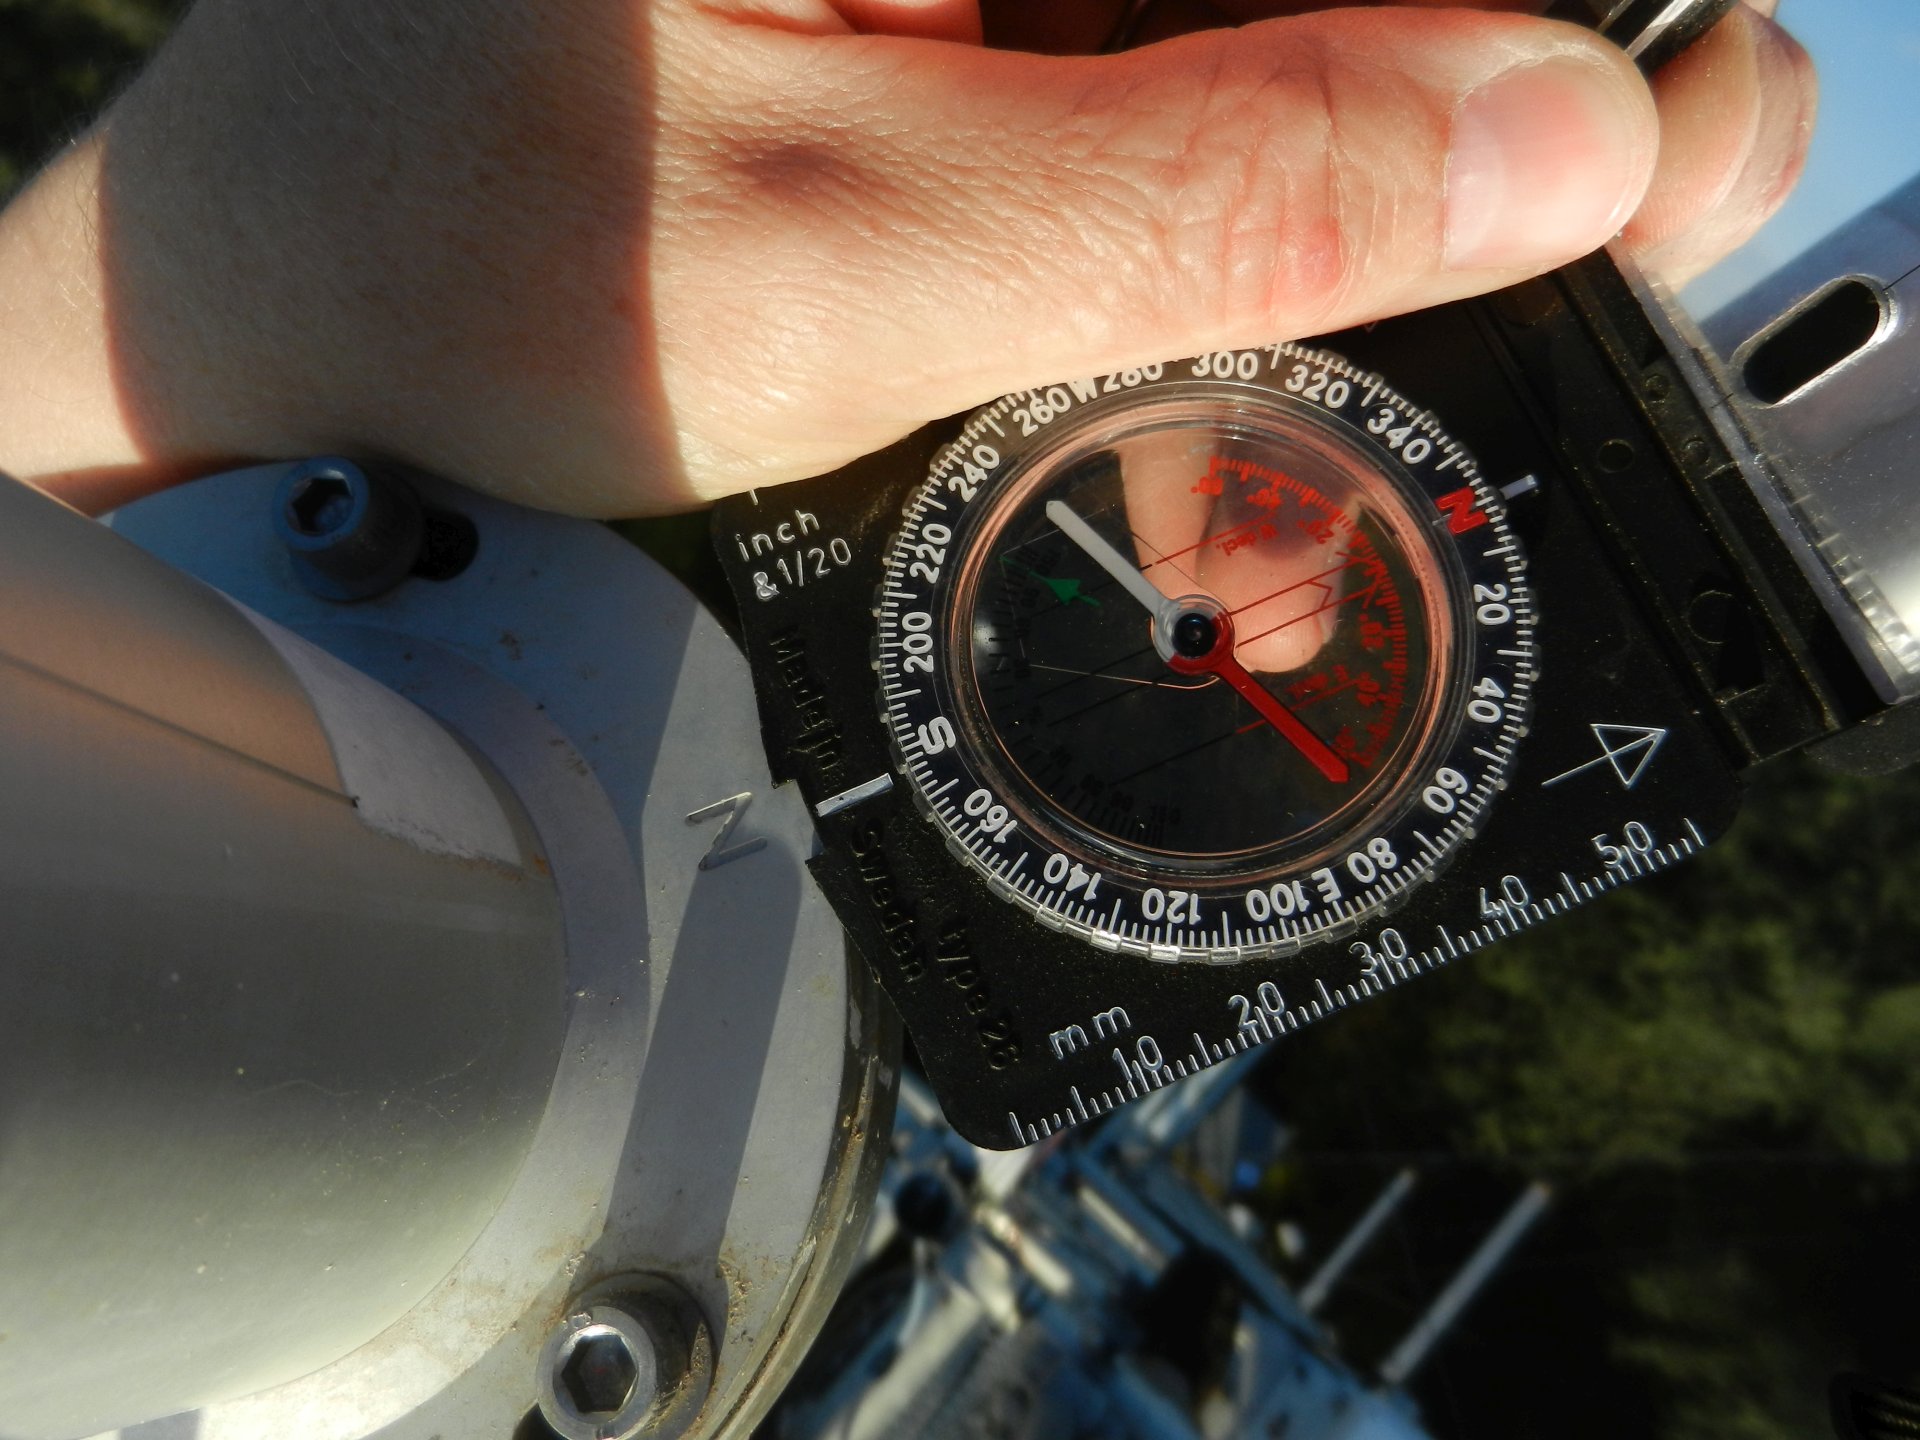
20140522TZ_TowerHeading.jpg ( 2014-05-22 06:49:13 ) Full size: 1920x1440
Tower sonic heading is 302 degrees True
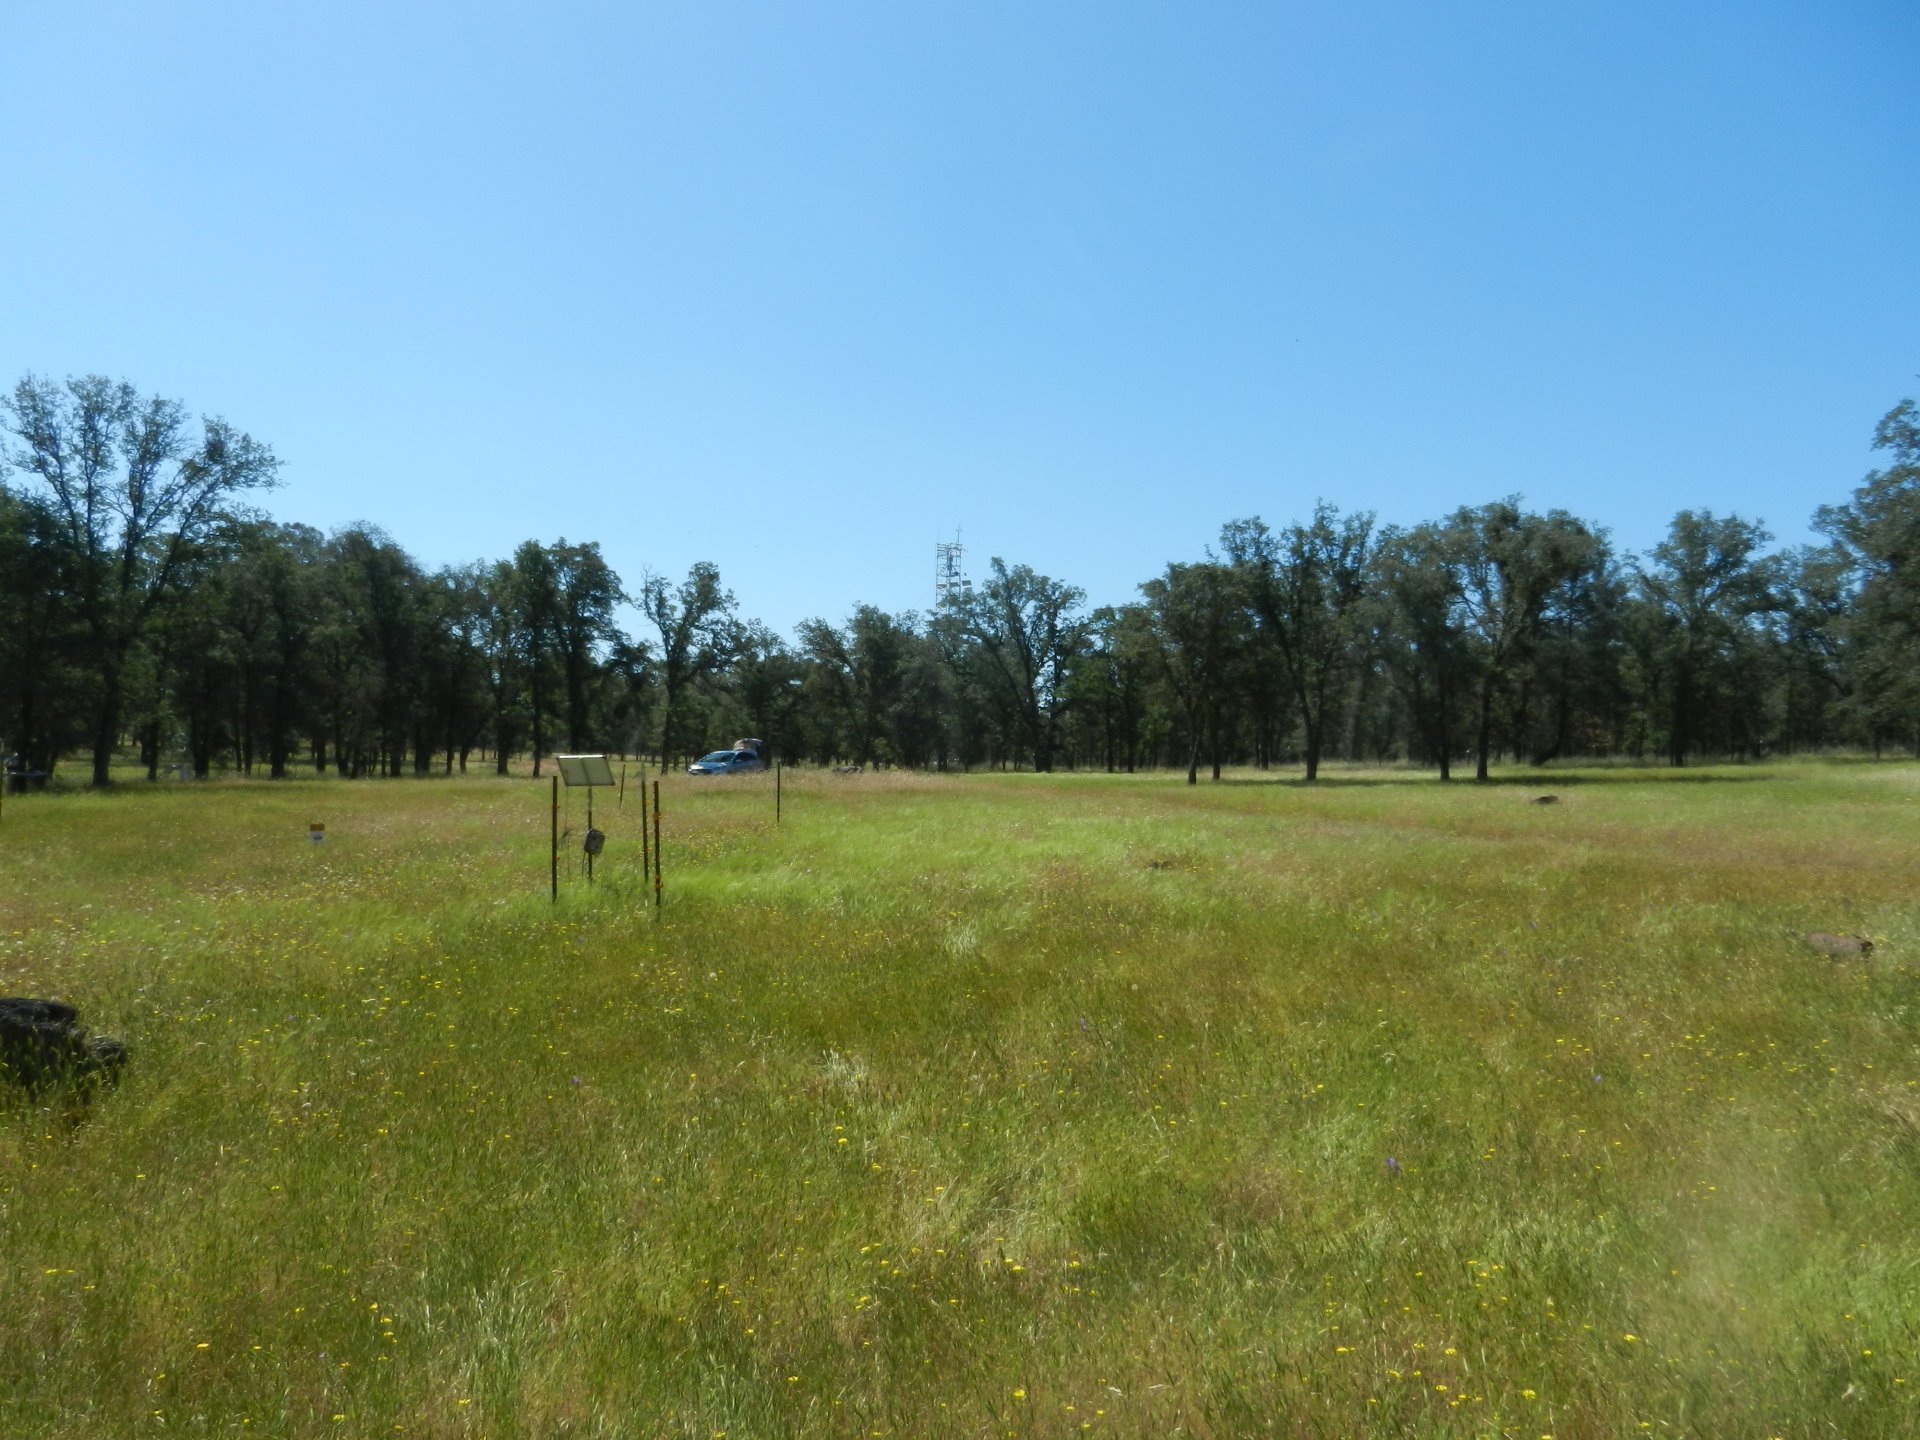
20140522TZ_TowerFromWest.jpg ( 2014-05-22 10:28:42 ) Full size: 1920x1440
View of tower from west
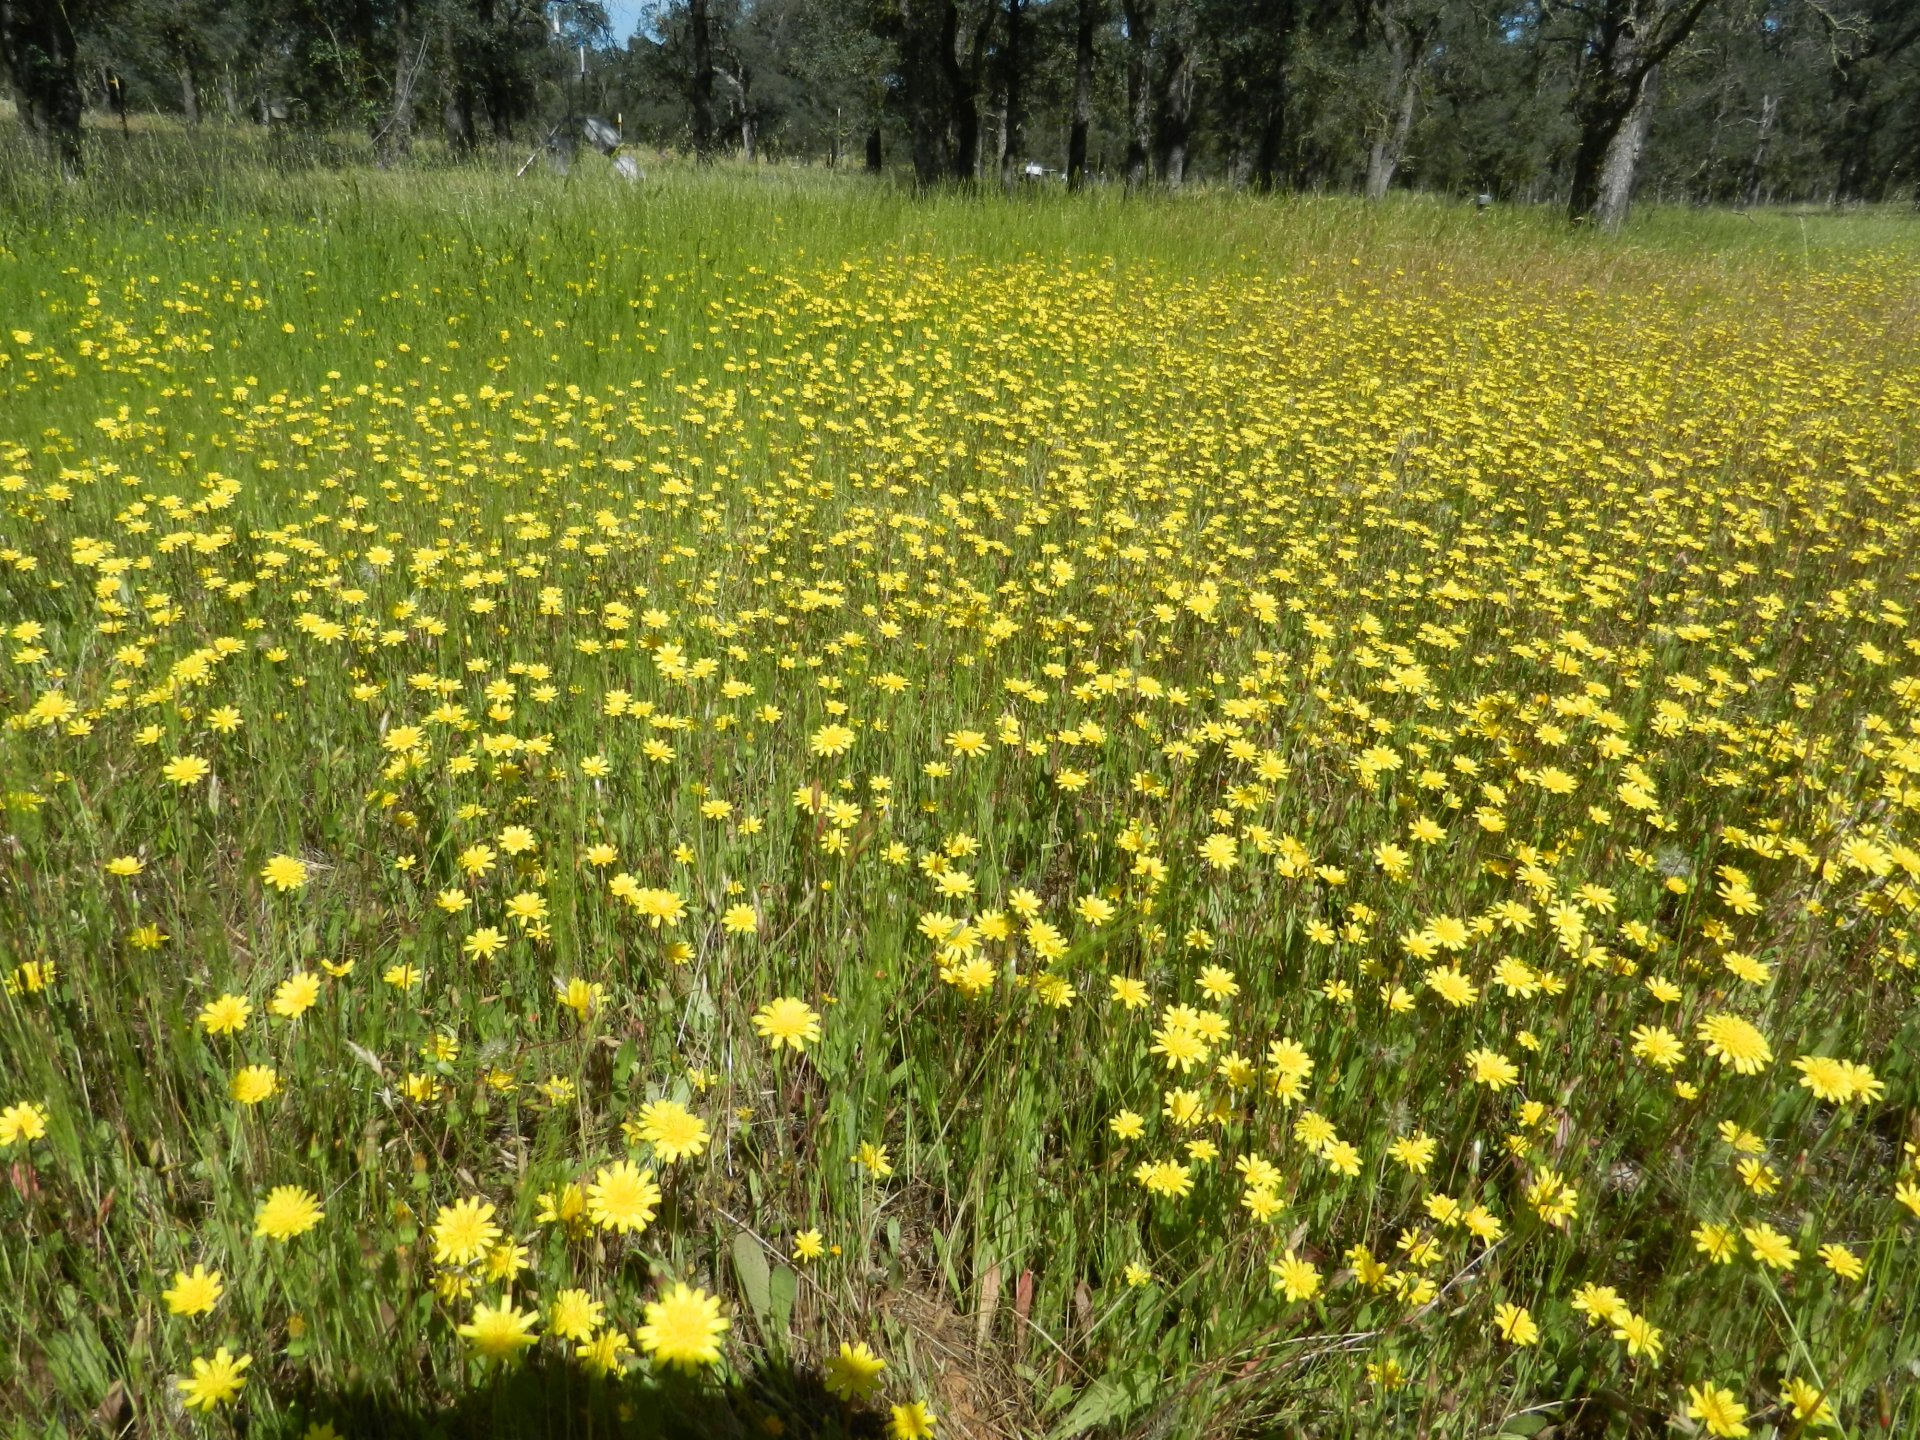
20140522TZ_Flowers.jpg ( 2014-05-22 10:01:38 ) Full size: 1920x1440
Lots of yellow dandelion flowers
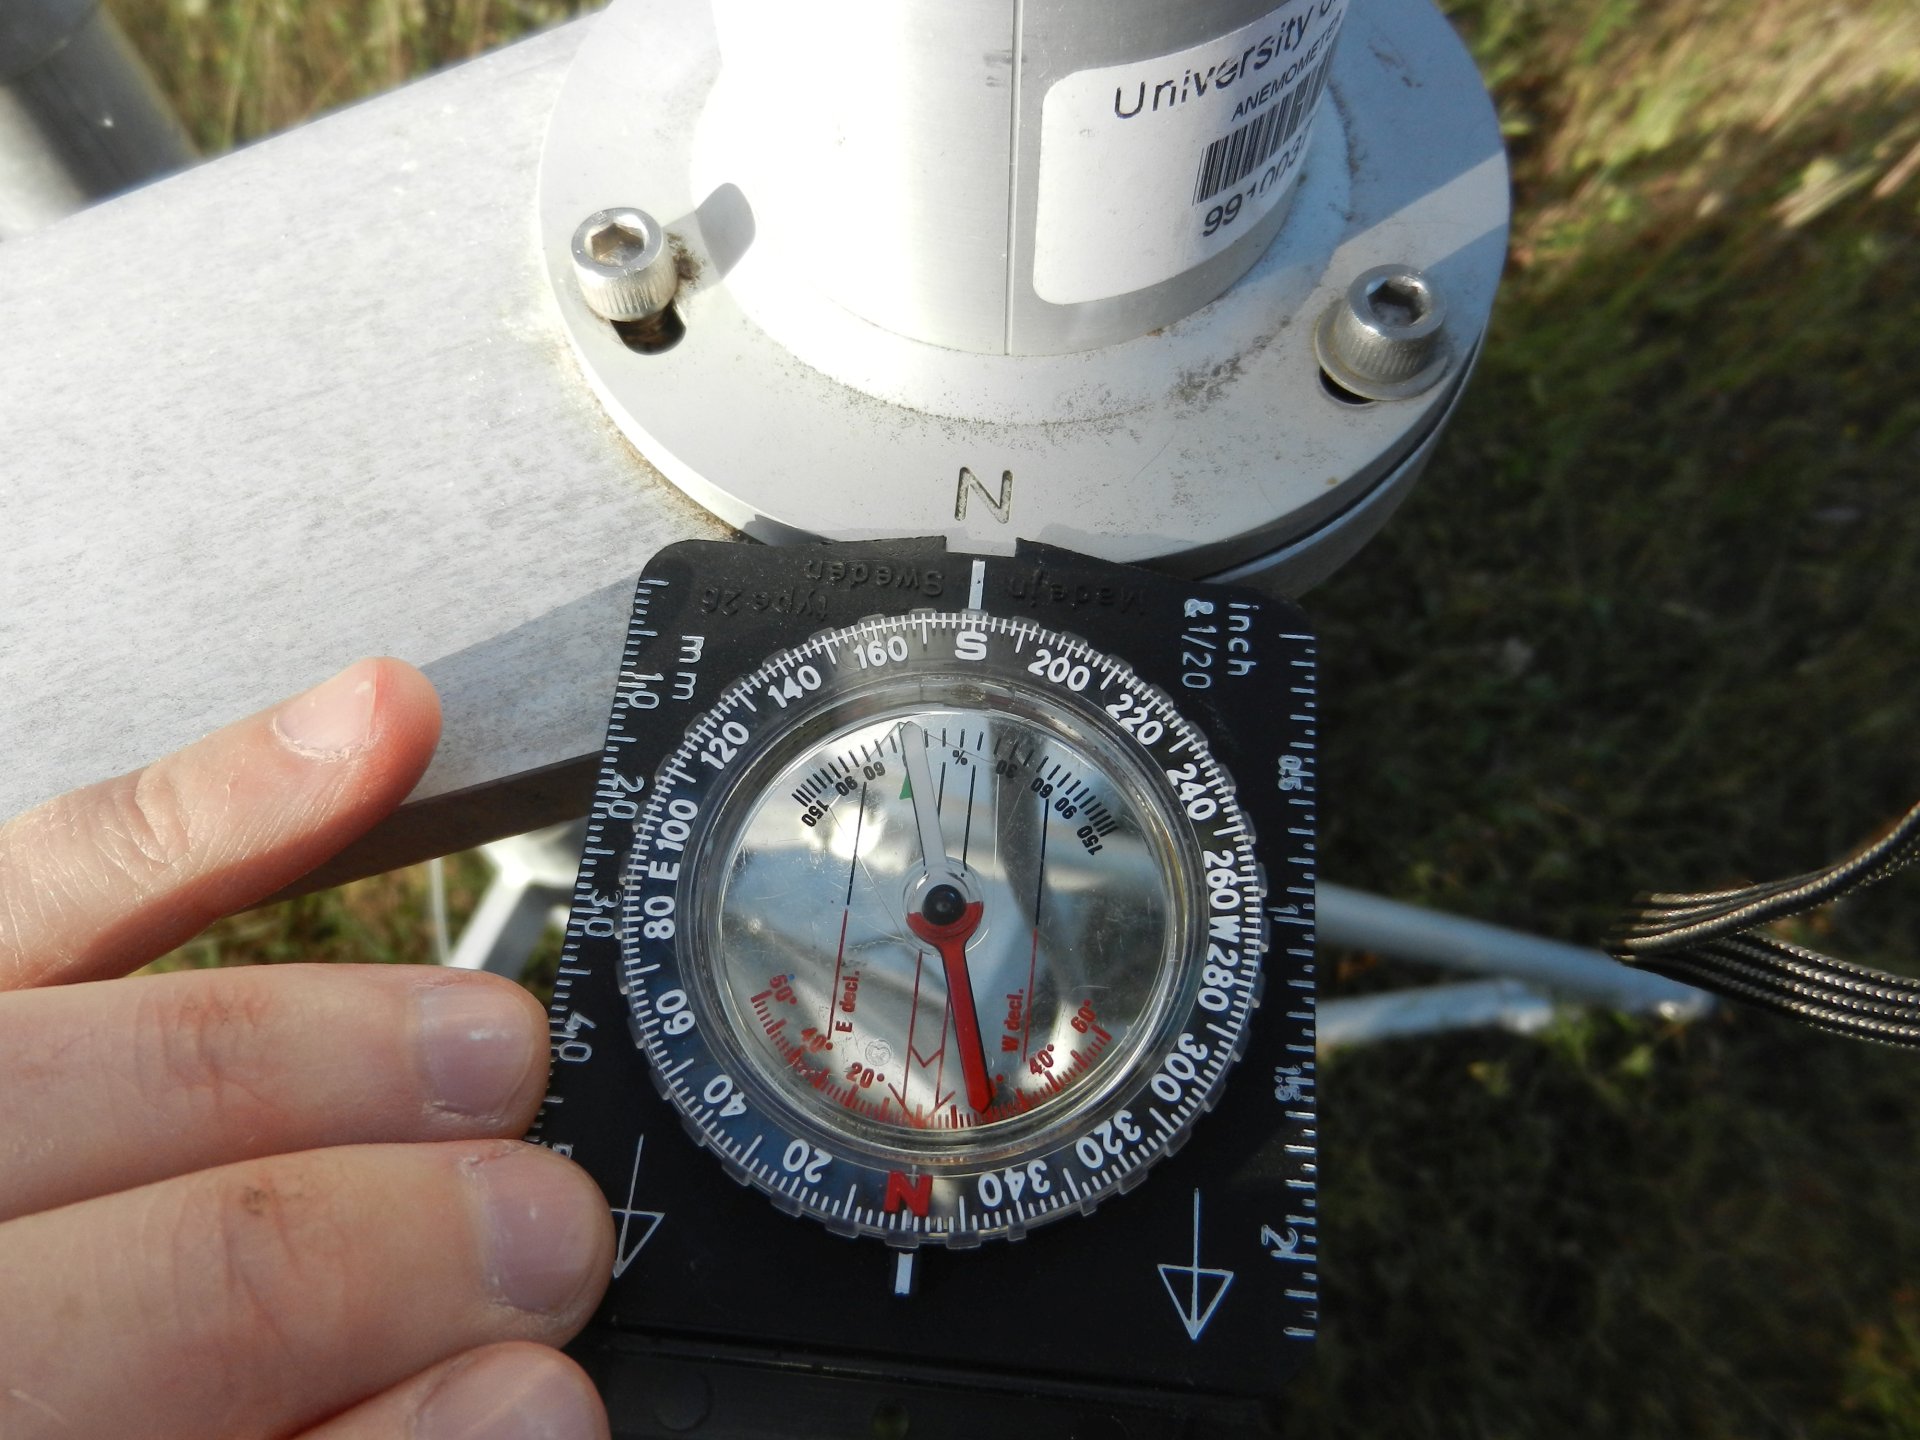
20140522TZ_FloorHeading.jpg ( 2014-05-22 07:25:10 ) Full size: 1920x1440
Floor sonic heading is 30 degrees True
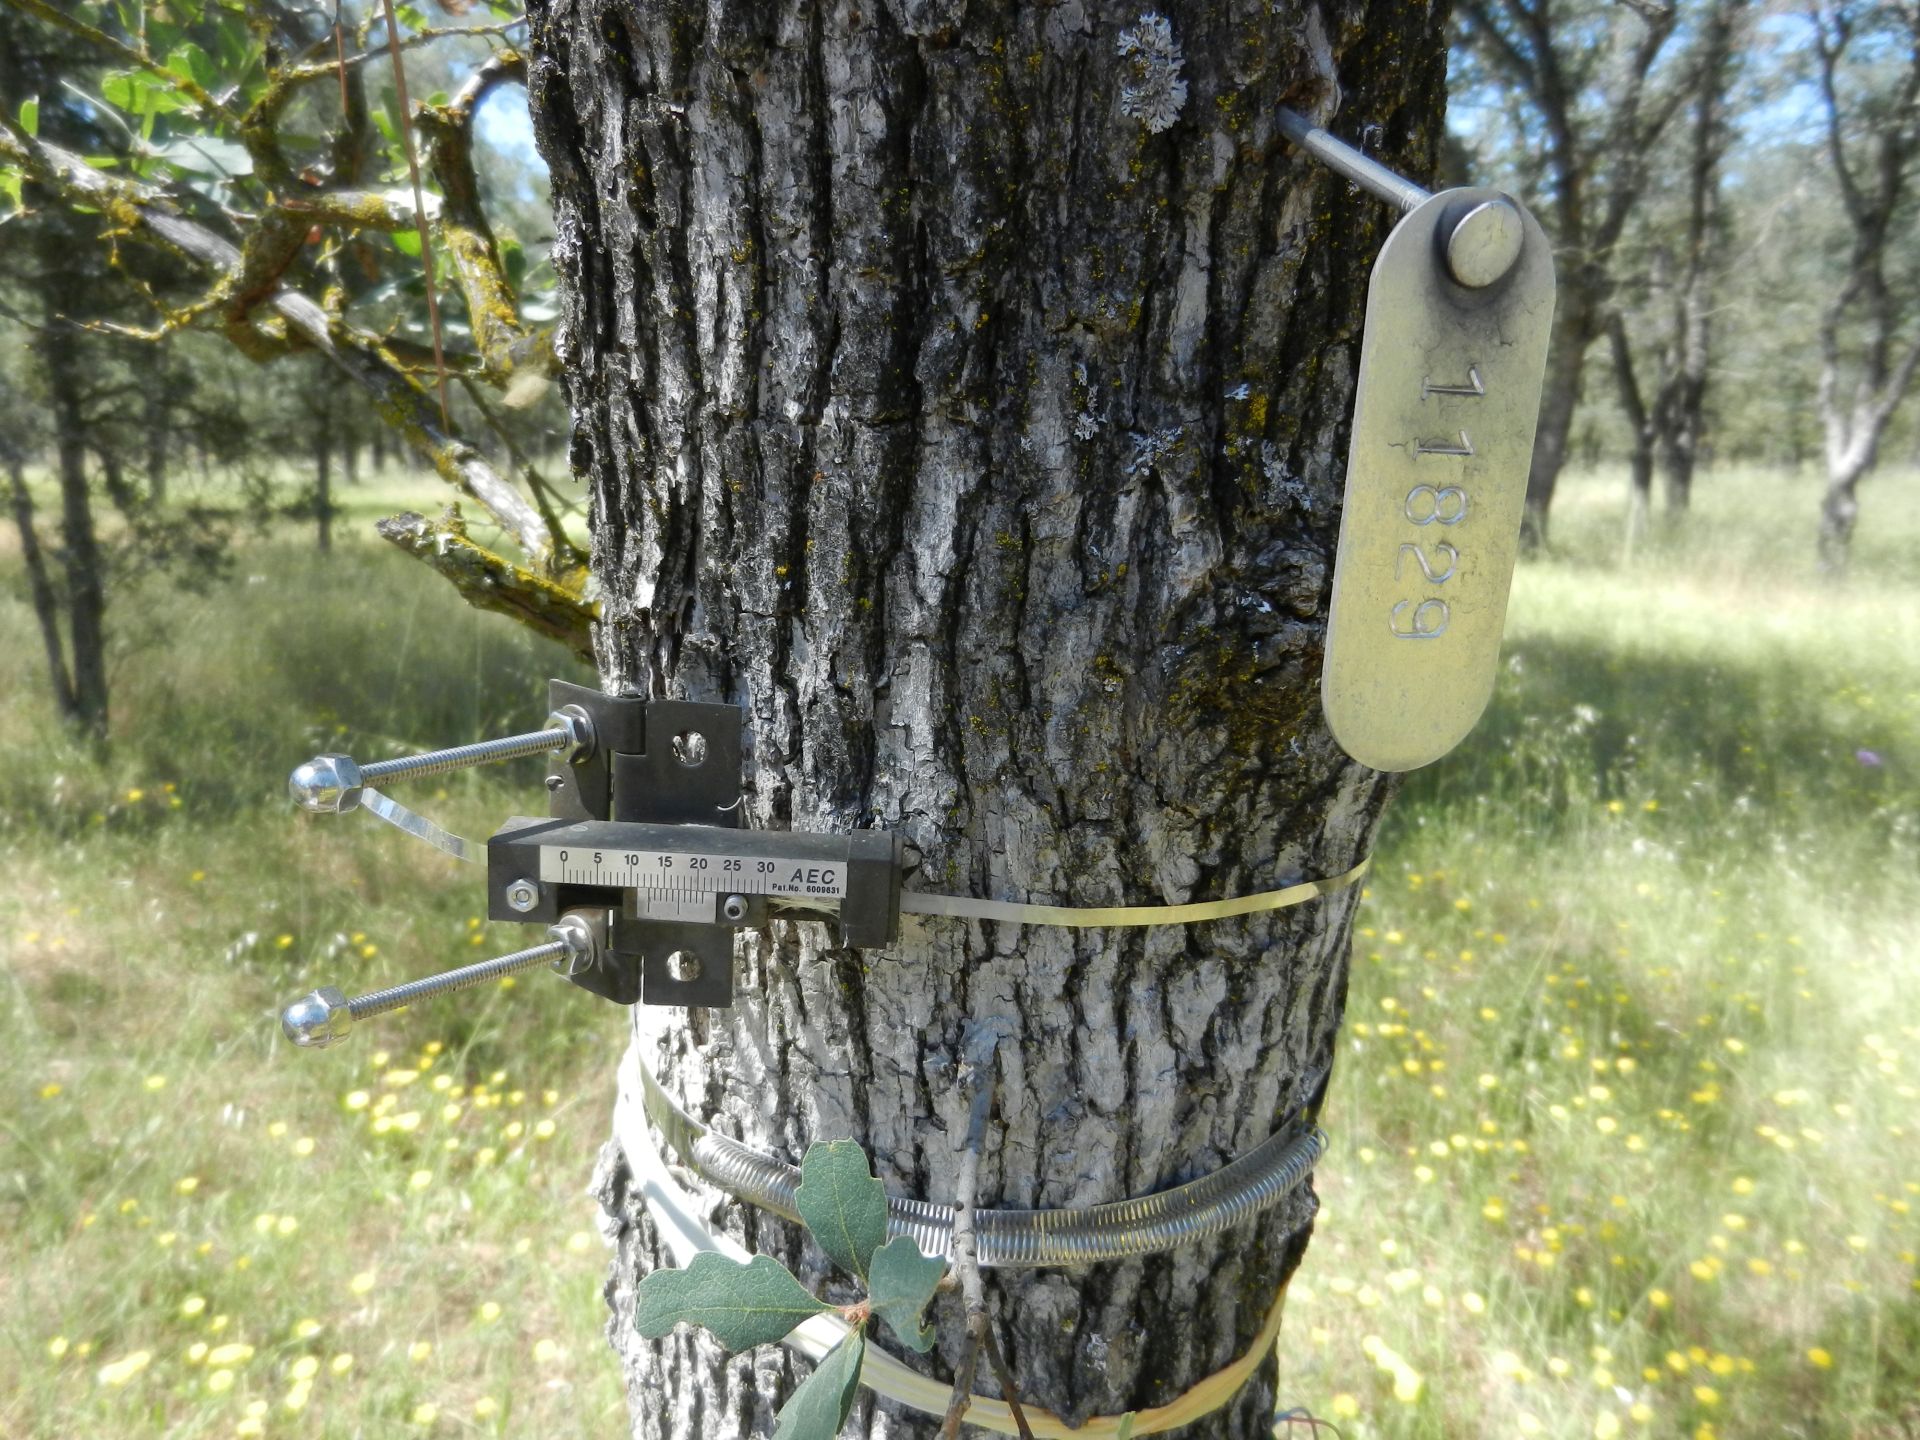
20140522TZ_Tree11829.jpg ( 2014-05-22 11:11:05 ) Full size: 1920x1440
Dendrometer on Tree 11829
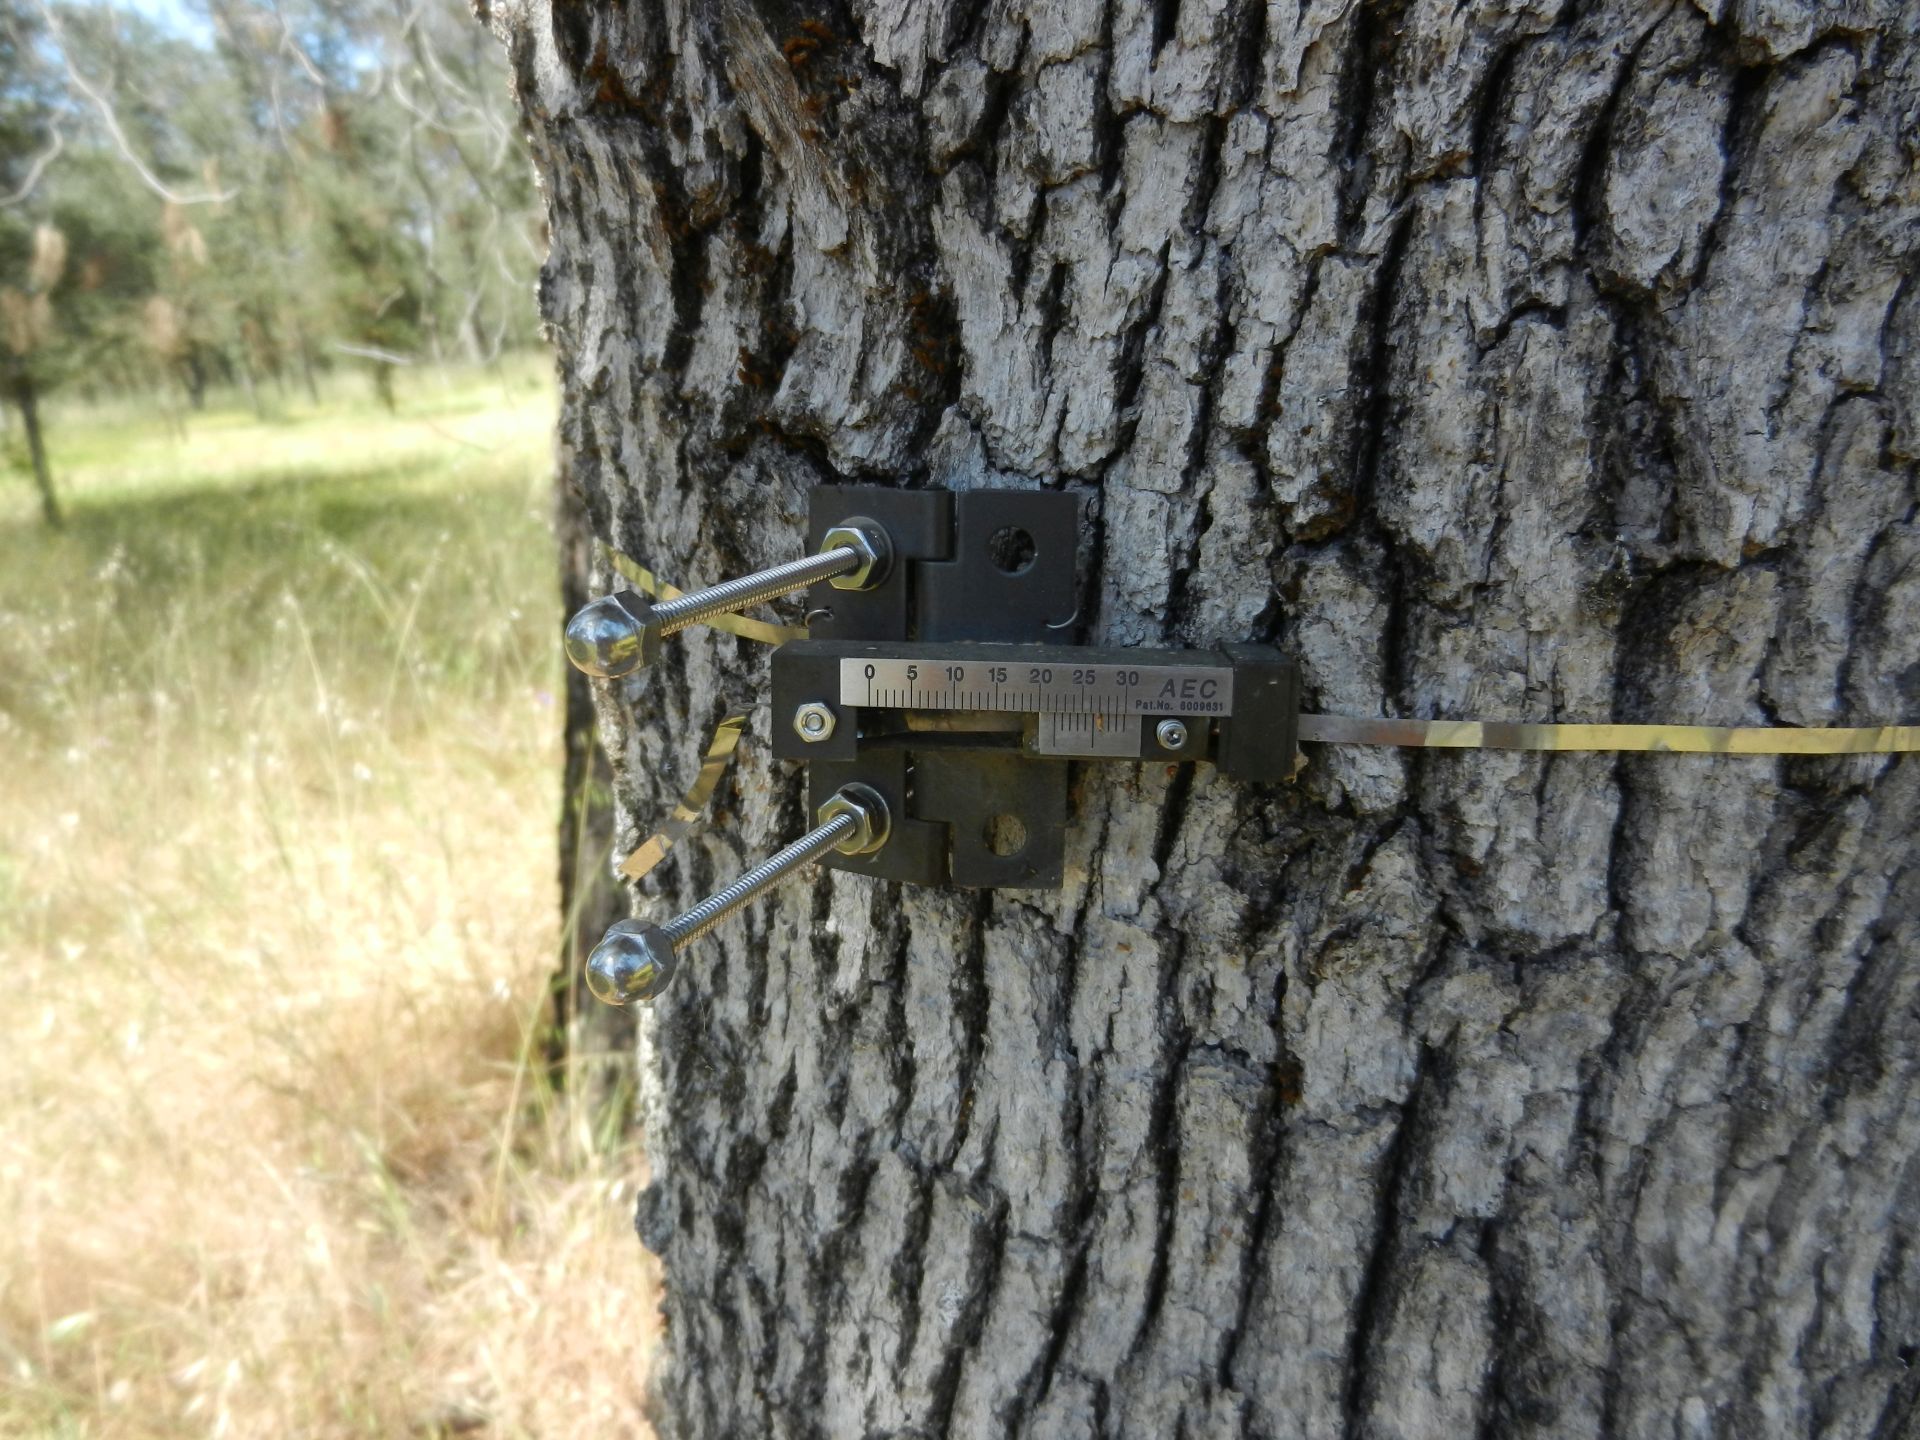
20140522TZ_Tree11828.jpg ( 2014-05-22 11:11:35 ) Full size: 1920x1440
Dendrometer on Tree 11828
16 sets found
No data found for TZ_Fenergy.
11 TZ_tmet graphs found
11 TZ_soilco2 graphs found
Can't check TZ_mixed
3 TZ_mixed graphs found
1 TZ_fflux graphs found
8 TZ_fmet graphs found
1 TZ_tram graphs found
3 TZ_co2prof graphs found
No data found for TZ_irt.
No data found for TZ_windprof.
1 TZ_tflux graphs found
2 TZ_sm graphs found
Can't check TZ_met
1 TZ_met graphs found
Can't check TZVR_mixed
8 TZ_osu graphs found
No data found for TZ_fd.
Tonzi Z-cam data