
Field Notes
<--2014-04-22 05:45:00 | 2014-05-08 05:50:00-->Other sites visited today: Vaira | Tonzi
Phenocam link: Searching...
Tonzi: 2014-04-22 05:45:00 (DOY 112)
Author: Joe Verfaillie
Others: Siyan
Summary: Predawn water potential, fix z-cam 1 wire, fixed CO2 profile, did not fix tram and floor hmp45 fan, condensation in diffuse sensor.
| Tonzi 2014-04-22 I arrived at about 5:45am PDT with Siyan for predawn water potential. The day was cool and partly cloudy with a breeze from the south west. The grass looks good and the tree seemed to be done putting on leaves. The ground is still damp in low areas, but Tonzi’s pond is only about half full. I worked on running a new wire for z-cam 1 to the south of the tower. The new wire is run in the air from the tower through the trees. It has three conductors: one 12VDC power for the camera, a switched 12VDC for the power button relay, and they both share the same ground. It seemed to work well. I reset the clock on the z-cam CR10X, it was about 5 minutes behind. I serviced all the zcams. The tram was not moving near mid-track. I reset it and it ran to park just fine. Later I found it stuck mid track again. I brought it in thinking the battery was bad, but the battery tested okay in the lab. I cleaned the radiation sensors on the tower top. The diffuse sensor had a lot of condensation inside its dome. It has an internal desiccant pack that should be replaced, but I need the manual to figure out how and a replacement pack. The fan for the floor HMP45 was dead. I removed the fan, need a new one for next time. The CO2 profile on the tower was reading negative and could not be calibrated. I took it apart and found what looked like a water stain in the cell. I was able to clean it in the field and it calibrated well. We went to Vaira about 9am and returned about 10:30. |
Veg Height (cm): Tape measure from ground to top of plant
32, 15, 24, 20, 28, 19, 33, 19, 13, 10, 15, 12, 18, 29, 25, 20, avg = 20.8, stdev = 7.11
Field Data
CO2 Profile Tanks
| Date | Tank | Pressure (psi) | ppm |
|---|---|---|---|
| 2014-04-22 | CO2 | 1900 | 502.68 |
| 2014-04-22 | N2 | 500 | 0 |
Well Depth
| Date | Location | Depth (feet) |
|---|---|---|
| 2014-04-22 | TZ_floor | 30 |
| 2014-04-22 | TZ_road | 38.2 |
| 2014-04-22 | TZ_tower | 38 |
mode = both
Moisture Point Probes TZ
Array
(
[0] => Tower_1
[1] => Floor_South_1
[2] => Floor_East_1
[3] => SoilCO2_1
[4] => Soil_Transect_4_1
[5] => Soil_Transect_3_1
[6] => Soil_Transect_2_1
[7] => Soil_Transect_1_1
[8] => SoilCO2_West_A_1
[9] => SoilCO2_West_B_1
[10] => SoilCO2_West_C_1
[11] => Tower_2
[12] => Floor_South_2
[13] => Floor_East_2
[14] => Floor_West_2
[15] => SoilCO2_2
[16] => Soil_Transect_4_2
[17] => Soil_Transect_3_2
[18] => Soil_Transect_2_2
[19] => Soil_Transect_1_2
[20] => SoilCO2_West_A_2
[21] => SoilCO2_West_B_2
[22] => SoilCO2_West_C_2
[23] => Tower_3
[24] => Floor_South_3
[25] => Floor_East_3
[26] => Floor_West_3
[27] => SoilCO2_3
[28] => Soil_Transect_4_3
[29] => Soil_Transect_3_3
[30] => Soil_Transect_2_3
[31] => Soil_Transect_1_3
[32] => SoilCO2_West_A_3
[33] => SoilCO2_West_B_3
[34] => SoilCO2_West_C_3
[35] => Tower_4
[36] => Floor_South_4
[37] => Floor_East_4
[38] => SoilCO2_4
[39] => Soil_Transect_4_4
[40] => Soil_Transect_3_4
[41] => Soil_Transect_2_4
[42] => Soil_Transect_1_4
[43] => SoilCO2_West_A_4
[44] => SoilCO2_West_B_4
[45] => SoilCO2_West_C_4
)
| Date | DOY | Rep | Depth | Tower_1 |
Floor_South_1 |
Floor_East_1 |
SoilCO2_1 |
Soil_Transect_4_1 |
Soil_Transect_3_1 |
Soil_Transect_2_1 |
Soil_Transect_1_1 |
SoilCO2_West_A_1 |
SoilCO2_West_B_1 |
SoilCO2_West_C_1 |
Tower_2 |
Floor_South_2 |
Floor_East_2 |
Floor_West_2 |
SoilCO2_2 |
Soil_Transect_4_2 |
Soil_Transect_3_2 |
Soil_Transect_2_2 |
Soil_Transect_1_2 |
SoilCO2_West_A_2 |
SoilCO2_West_B_2 |
SoilCO2_West_C_2 |
Tower_3 |
Floor_South_3 |
Floor_East_3 |
Floor_West_3 |
SoilCO2_3 |
Soil_Transect_4_3 |
Soil_Transect_3_3 |
Soil_Transect_2_3 |
Soil_Transect_1_3 |
SoilCO2_West_A_3 |
SoilCO2_West_B_3 |
SoilCO2_West_C_3 |
Tower_4 |
Floor_South_4 |
Floor_East_4 |
SoilCO2_4 |
Soil_Transect_4_4 |
Soil_Transect_3_4 |
Soil_Transect_2_4 |
Soil_Transect_1_4 |
SoilCO2_West_A_4 |
SoilCO2_West_B_4 |
SoilCO2_West_C_4 |
Avg | Spacial Count |
Measurement Count |
|---|---|---|---|---|---|---|---|---|---|---|---|---|---|---|---|---|---|---|---|---|---|---|---|---|---|---|---|---|---|---|---|---|---|---|---|---|---|---|---|---|---|---|---|---|---|---|---|---|---|---|---|---|
| 2014-04-22 | 112 | 0 | nan | 18.5 | 11.2 | 39.9 | 29.4 | 12.1 | 39.9 | 13.2 | 10.6 | 17.3 | 13.8 | 9.4 | 22.8 | 50 | 21.3 | 24.6 | 26.1 | 17.3 | 34.7 | 24.3 | 10.3 | 18.2 | 4.2 | 23.1 | 32.7 | 36 | 36.8 | 50.2 | 56.9 | 17.6 | 46.6 | 28.8 | 26.2 | 29.9 | 26.5 | 29.9 | 30.2 | 42.8 | 65.5 | 11.1 | 23.6 | 20.5 | 44.8 | 20.5 | 41.7 | 47.4 | 47.1 | |||
| 2014-04-22 | 112 | 1 | nan | 19.7 | 10.4 | 39.9 | 27.1 | 12.4 | 39.9 | 13.8 | 10.3 | 17.1 | 13.8 | 9.7 | 22.5 | 20 | 20.6 | 24.5 | 23.7 | 17.6 | 26.3 | 25.2 | 9.7 | 17.6 | 4.5 | 22.5 | 32.7 | 32.9 | 36.8 | 31 | 44.1 | 17.9 | 29.7 | 28.5 | 26.2 | 29.3 | 27.6 | 29 | 31.9 | 43.7 | 41.4 | 11.1 | 23.6 | 18.8 | 46 | 21.9 | 42 | 46.6 | 48.6 | |||
| 2014-04-22 | 112 | 2 | nan | 39.9 | 30 | 19.1 | ||||||||||||||||||||||||||||||||||||||||||||||
| 2014-04-22 | 112 | Avg | 0-15cm | 0 | 0 | |||||||||||||||||||||||||||||||||||||||||||||||
| 2014-04-22 | 112 | Avg | 15-30cm | 0 | 0 | |||||||||||||||||||||||||||||||||||||||||||||||
| 2014-04-22 | 112 | Avg | 30-45cm | 0 | 0 | |||||||||||||||||||||||||||||||||||||||||||||||
| 2014-04-22 | 112 | Avg | 45-60cm | 0 | 0 |
mode = both
Moisture Point Probes VR
Array
(
[0] => Solar_Panels_1
[1] => Flux_Tower_1
[2] => Gate_1
[3] => Biomass_Cage_1
[4] => Solar_Panels_2
[5] => Flux_Tower_2
[6] => Gate_2
[7] => Biomass_Cage_2
[8] => Solar_Panels_3
[9] => Flux_Tower_3
[10] => Gate_3
[11] => Biomass_Cage_3
[12] => Solar_Panels_4
[13] => Flux_Tower_4
[14] => Gate_4
[15] => Biomass_Cage_4
)
| Date | DOY | Rep | Depth | Solar_Panels_1 |
Flux_Tower_1 |
Gate_1 |
Biomass_Cage_1 |
Solar_Panels_2 |
Flux_Tower_2 |
Gate_2 |
Biomass_Cage_2 |
Solar_Panels_3 |
Flux_Tower_3 |
Gate_3 |
Biomass_Cage_3 |
Solar_Panels_4 |
Flux_Tower_4 |
Gate_4 |
Biomass_Cage_4 |
Avg | Spacial Count |
Measurement Count |
|---|---|---|---|---|---|---|---|---|---|---|---|---|---|---|---|---|---|---|---|---|---|---|
| 2014-04-22 | 112 | 0 | nan | 5.9 | 10 | 27.4 | 2.4 | 15.2 | 13 | 11.8 | 9.7 | 20.1 | 6.4 | 30 | 18.4 | 33.1 | 18.8 | 31.7 | 21.1 | |||
| 2014-04-22 | 112 | 1 | nan | 6.2 | 10 | 26.5 | 2.1 | 15.5 | 13.6 | 11.8 | 9.3 | 19.8 | 5.9 | 30.3 | 18.2 | 33.1 | 18.8 | 31.4 | 20.8 | |||
| 2014-04-22 | 112 | Avg | 0-15cm | 0 | 0 | |||||||||||||||||
| 2014-04-22 | 112 | Avg | 15-30cm | 0 | 0 | |||||||||||||||||
| 2014-04-22 | 112 | Avg | 30-45cm | 0 | 0 | |||||||||||||||||
| 2014-04-22 | 112 | Avg | 45-60cm | 0 | 0 |
Grass Height TZ 16
| Date | Height reps (cm) | Location | Average | Samp | STDEV | |||||||||||||||
|---|---|---|---|---|---|---|---|---|---|---|---|---|---|---|---|---|---|---|---|---|
| 2014-04-22 | 32 | 15 | 24 | 20 | 28 | 19 | 33 | 19 | 13 | 10 | 15 | 12 | 18 | 29 | 25 | 20 | GH_ALL | 20.75 | 16 | 6.89 |
Grass Height VR 9
| Date | Height reps (cm) | Location | Average | Samp | STDEV | ||||||||
|---|---|---|---|---|---|---|---|---|---|---|---|---|---|
| 2014-04-22 | 25 | 18 | 8 | 11 | GH_CLOVER | 15.5 | 4 | 6.58 | |||||
| 2014-04-22 | 46 | 36 | 30 | 64 | 47 | 70 | 52 | 50 | 37 | GH_FENCED | 48 | 9 | 12.27 |
| 2014-04-22 | 52 | 60 | 40 | 60 | 46 | 30 | 58 | GH_OUT | 49.43 | 7 | 10.57 | ||
Tree DBH
| Date | Tag# | Reading (mm) |
|---|---|---|
| 2014-04-22 | 1 | 25.2 |
| 2014-04-22 | 102 | 22.9 |
| 2014-04-22 | 2 | 20.7 |
| 2014-04-22 | 245 | 17.0 |
| 2014-04-22 | 3 | 23.3 |
| 2014-04-22 | 5 | 25.9 |
| 2014-04-22 | 7 | 20.7 |
| 2014-04-22 | 72 | 18.0 |
| 2014-04-22 | 79 | 23.0 |
| 2014-04-22 | 8 | 11.9 |
Water Potential - mode: raw
| Time | Species | Tree | readings (bar) | ||
|---|---|---|---|---|---|
| 2014-04-22 05:56:00 | OAK | 102 | -3.5 | -2 | -2.5 |
| 2014-04-22 05:56:00 | OAK | 35 | -2.5 | -5.5 | -5 |
| 2014-04-22 05:56:00 | OAK | 92 | -2.5 | -3.5 | -3.5 |
| 2014-04-22 06:19:00 | PINE | OLD | -7 | -9.5 | -9 |
| 2014-04-22 06:19:00 | PINE | YNG | -7 | -8 | -3.5 |
| 2014-04-22 11:10:00 | OAK | 102 | -8 | -10 | -10 |
| 2014-04-22 11:10:00 | OAK | 35 | -12 | -22 | -15 |
| 2014-04-22 11:10:00 | OAK | 92 | -13 | -20 | -11 |
| 2014-04-22 11:32:00 | PINE | OLD | -15 | -22 | -21 |
| 2014-04-22 11:32:00 | PINE | YNG | -8 | -18 | -22 |
Biomass TZ Grass
| Date | rep | AREA (cm2) | LEAFNO (count) | LEAFAREA (cm2) | Green WETWT (g) | Green DRYWT (g) | Brown WETWT (g) | Brown DRYWT (g) | LAI (m2/m2) |
Green WETWT/AREA (g/m2) |
Green DRYWT/AREA (g/m2) |
Brown WETWT/AREA (g/m2) |
Brown DRYWT/AREA (g/m2) |
|---|---|---|---|---|---|---|---|---|---|---|---|---|---|
| 2014-04-22 | 0 | 400 | 561 | 14.19 | 4.28 | 1.4 | 252.94 | 76.29 | 0 | 0 | |||
| 2014-04-22 | 1 | 400 | 548 | 20.31 | 5.07 | 1.37 | 370.62 | 92.52 | 0 | 0 | |||
| 2014-04-22 | 2 | 400 | 692 | 31.68 | 7.59 | 1.73 | 457.8 | 109.68 | 0 | 0 | |||
| 2014-04-22 | SUM | ||||||||||||
| 2014-04-22 | CNT | 3 | 3 | 3 | 3 | 3 | 3 | 3 | |||||
| 2014-04-22 | AVG | 1.5 | 360.45 | 92.83 |
Biomass TZ OakLeaves
| Date | rep | AREA (cm2) | LEAFNO (count) | LEAFAREA (cm2) | Green WETWT (g) | Green DRYWT (g) | Brown WETWT (g) | Brown DRYWT (g) | Area/Leaf (cm2/leaf) |
Green WETWT/AREA (g/m2) |
Green DRYWT/AREA (g/m2) |
Brown WETWT/AREA (g/m2) |
Brown DRYWT/AREA (g/m2) |
|---|---|---|---|---|---|---|---|---|---|---|---|---|---|
| 2014-04-22 | 0 | 30 | 70.4 | 1.5 | 1.25 | 2.35 | 213.07 | 177.56 | 0 | 0 | |||
| 2014-04-22 | 1 | 40 | 120 | 2.48 | 1.17 | 3 | 206.67 | 97.5 | 0 | 0 | |||
| 2014-04-22 | 2 | 54 | 111 | 2.32 | 1.22 | 2.06 | 209.01 | 109.91 | 0 | 0 | |||
| 2014-04-22 | SUM | ||||||||||||
| 2014-04-22 | CNT | 3 | 3 | 3 | 3 | 3 | 3 | 3 | |||||
| 2014-04-22 | AVG | 2.47 | 209.58 | 128.32 |
Biomass TZ PineNeedles
| Date | rep | AREA (cm2) | LEAFNO (count) | LEAFAREA (cm2) | Green WETWT (g) | Green DRYWT (g) | Brown WETWT (g) | Brown DRYWT (g) | Area/Leaf (cm2/leaf) |
Green WETWT/AREA (g/m2) |
Green DRYWT/AREA (g/m2) |
Brown WETWT/AREA (g/m2) |
Brown DRYWT/AREA (g/m2) |
|---|---|---|---|---|---|---|---|---|---|---|---|---|---|
| 2014-04-22 | 0 | 4 | 15.1 | 0.98 | 0.47 | 3.78 | 649.01 | 311.26 | 0 | 0 | |||
| 2014-04-22 | 1 | 4 | 21.8 | 1.74 | 0.92 | 5.45 | 798.17 | 422.02 | 0 | 0 | |||
| 2014-04-22 | 2 | 4 | 17.1 | 1.35 | 0.71 | 4.28 | 789.47 | 415.2 | 0 | 0 | |||
| 2014-04-22 | SUM | ||||||||||||
| 2014-04-22 | CNT | 3 | 3 | 3 | 3 | 3 | 3 | 3 | |||||
| 2014-04-22 | AVG | 4.5 | 745.55 | 382.83 |
3 photos found
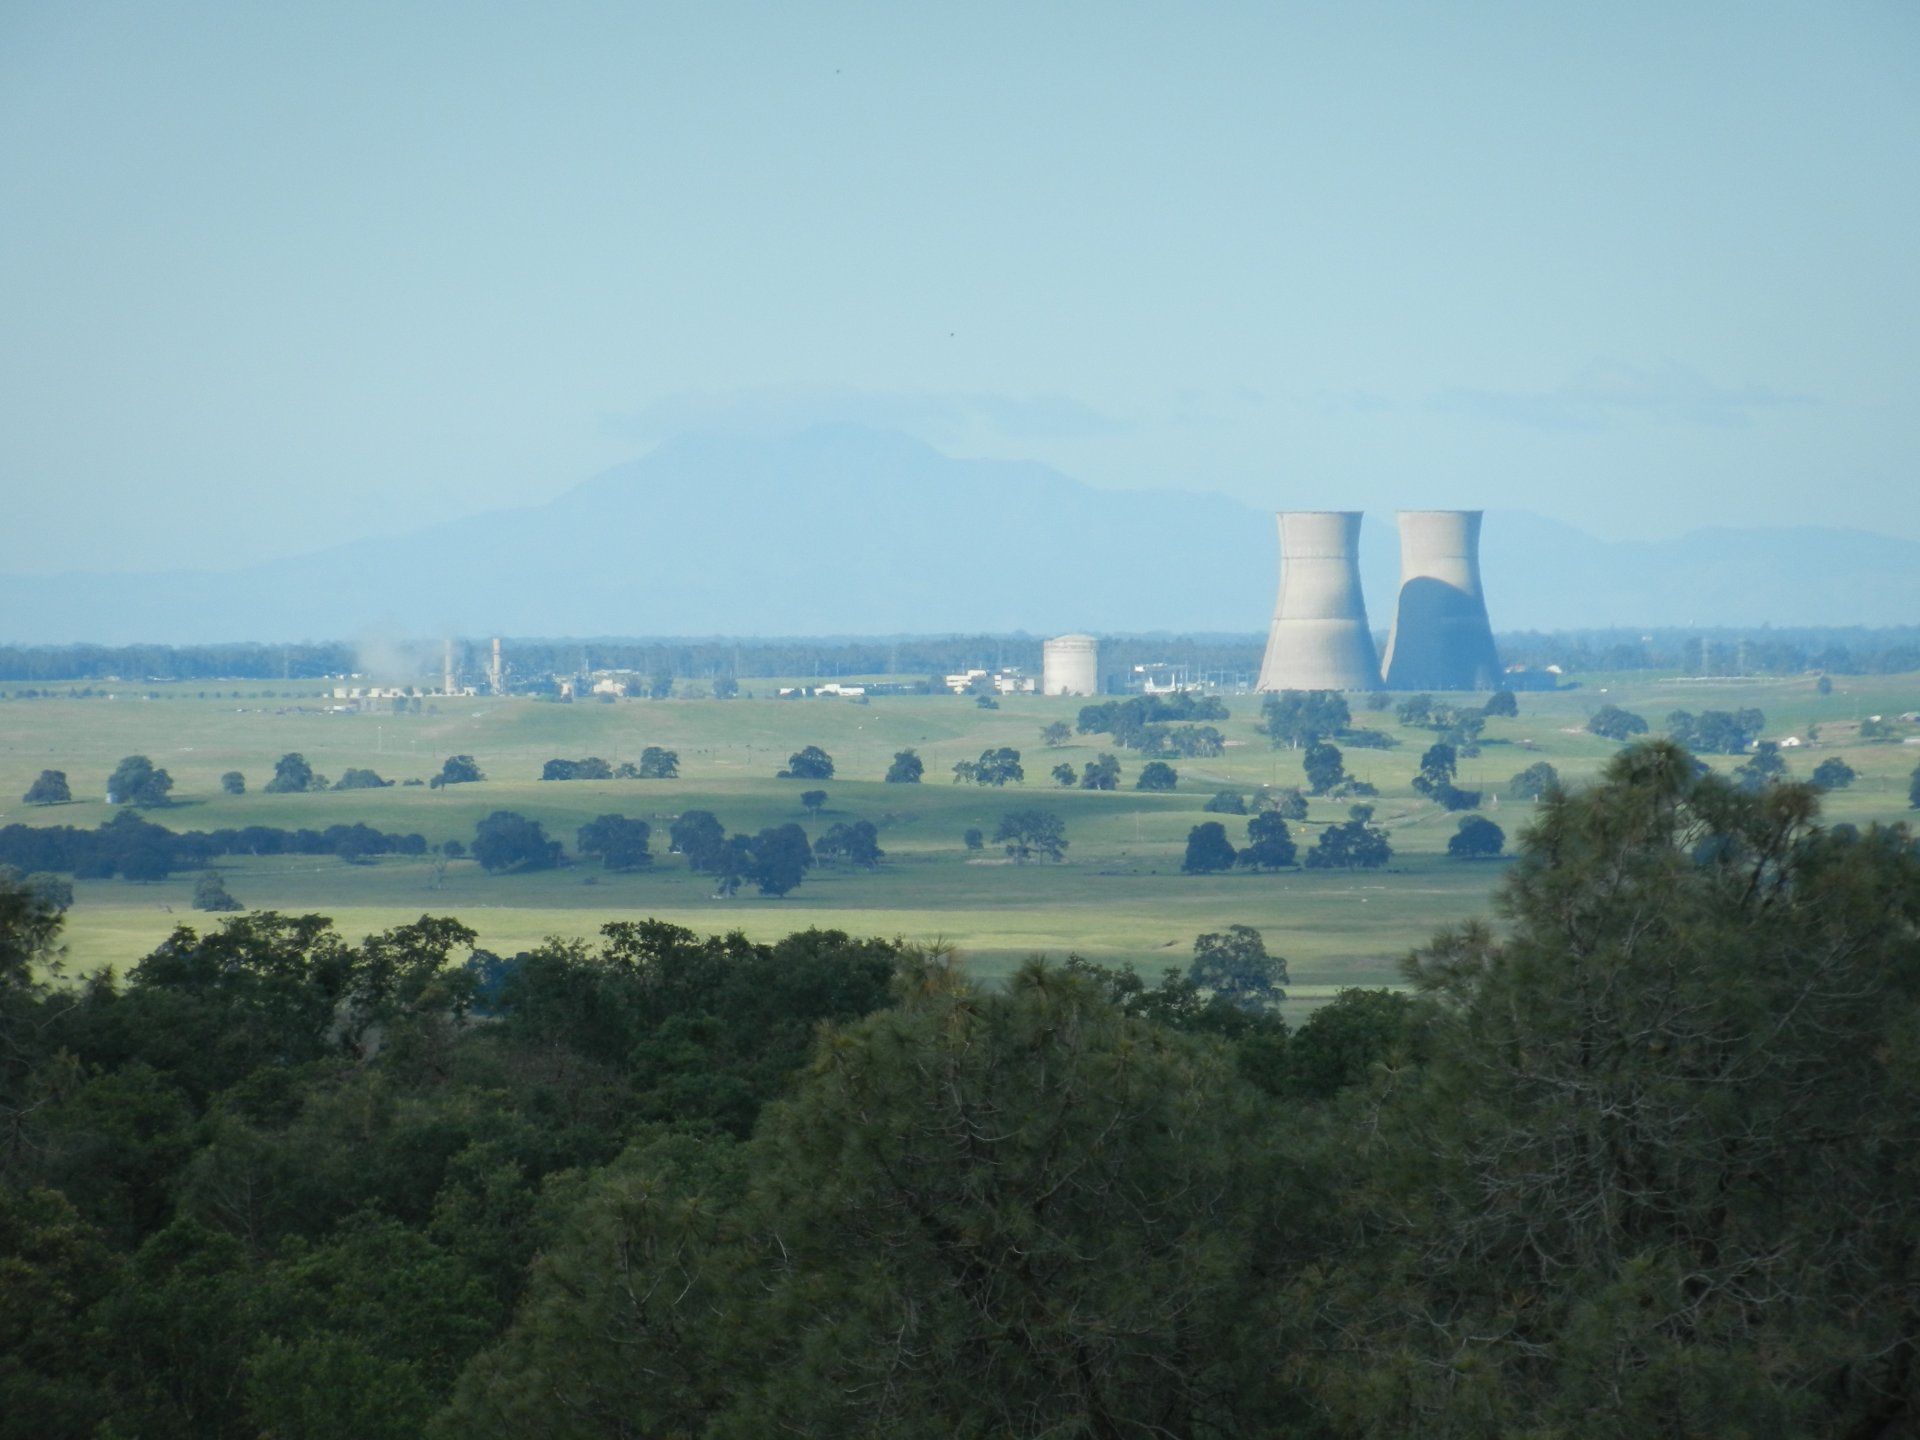
20140422TZ_SecoDiablo.jpg ( 2014-04-22 08:45:33 ) Full size: 1920x1440
Rancho Seco and Mt Diablo from the Tonzi Tower Top

20140422TZ_Site.jpg ( 2014-04-22 08:45:46 ) Full size: 1920x1440
Gray oaks and green grass from tower top

tonzi_2014_04_22_073103.jpg ( 2014-04-22 07:30:28 ) Full size: 1296x960
View from the tower with Joe and car on site
16 sets found
No data found for TZ_Fenergy.
11 TZ_tmet graphs found
11 TZ_soilco2 graphs found
Can't check TZ_mixed
3 TZ_mixed graphs found
1 TZ_fflux graphs found
8 TZ_fmet graphs found
1 TZ_tram graphs found
3 TZ_co2prof graphs found
No data found for TZ_irt.
No data found for TZ_windprof.
1 TZ_tflux graphs found
2 TZ_sm graphs found
Can't check TZ_met
1 TZ_met graphs found
Can't check TZVR_mixed
8 TZ_osu graphs found
No data found for TZ_fd.
Tonzi Z-cam data