Field Notes
<--2014-03-13 14:30:00 | 2014-04-03 13:40:00-->Other sites visited today: Sherman Island | Mayberry | Twitchell Rice | East End | West Pond | Tonzi
Phenocam link: Searching...
Twitchell Alfalfa: 2014-03-27 14:20:00 (DOY 86)
Author: Cove Sturtevant
Others: Patty
Summary: Regular field work. Swapped 7500. Swapped out rad tower solar controller. Removing 7700 from logging did not fix extra 9999 columns. Reflected PAR sensor covered with eggs.
| Twitchell Alfalfa 2014-03-27 We arrived about 14:20 PST It was overcast, cool, and calm-ish. Alfalfa growing steadily. I downloaded data and did other tower maintenance while Patty did spectral, veg height, and clip plots. I swapped out the 7500 for a freshly calibrated one (removed sn 0065, installed sn 75H-2180), adjusting the pressure cal in the 7550. I also swapped out the solar controller on the radiation tower because the power has been funky. We shall see if it corrects the problem. I removed the 7700 from the logging but after checking the data file the extra 9999 columns were still present. Not sure the fix for this issue. 7500 readings: CO2 = 392 ppm (400 after cleaning, 400 after swap) H2O = 470 mmol m-3 (480 after cleaning, 480 after swap) SS = 79.2% (79.65% after cleaning, 94.0% after swap) sos = 344.4 m s-1 Cleaned radiation sensors. There were insect eggs completely covering the reflected PAR sensor. Yucky. |
Veg Height (cm): Tape measure from ground to top of plant
34, 34, 32, 34, 20, 37, 40, 20, 40, 35, 36, 43, 32, 28, 33, 15, 30, 27, 35, 29, avg = 31.7, stdev = 7.07
1 photos found

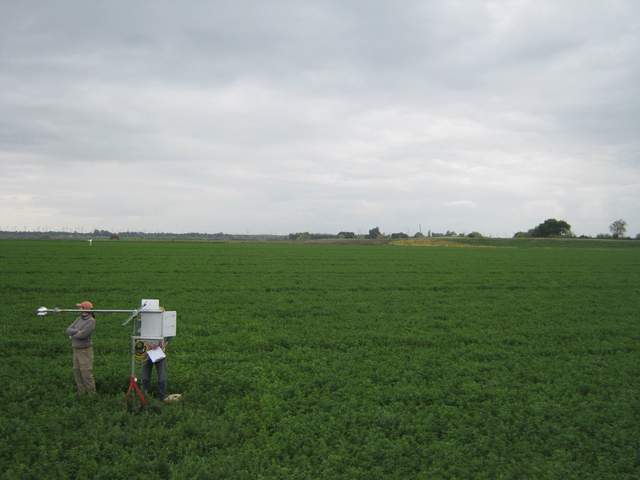
TA_autocam_20140327_1415.jpg ( 2014-03-27 14:15:02 ) Full size: 1920x1440
Patty and Cove doing fieldwork
7 sets found
Can't check TA_met
11 TA_met graphs found
Can't check TA_rad
3 TA_rad graphs found
Can't check TA_flux
5 TA_flux graphs found
Can't check TA_soilco2
7 TA_soilco2 graphs found
No data found for TA_arable.
1 TA_cam graphs found
Can't check TATWBABCSB_cam

