
Field Notes
<--2014-03-07 10:35:00 | 2014-03-27 14:20:00-->Other sites visited today: Sherman Island | Mayberry | Twitchell Rice | East End | West Pond
Phenocam link: Searching...
Twitchell Alfalfa: 2014-03-13 14:30:00 (DOY 72)
Author: Sara Knox
Others: Patty
Summary: Alfalfa growing. Standard fieldwork. Data download.
| Twitchell Alfalfa 2014-03-13 We arrived about 14:30 PDT. It was partly sunny, breezy, and warm. The alfalfa has grown considerably since last week, which means we should start doing clip plots again (how I missed that...). I downloaded data while Patty did spectral measurements, measured vegetation height, tightened the RAD solar panel, and measured instrument heights. 7500 height: 307 cm above ground surface where the scaffold is installed, but that is about 30 cm below the alfalfa field. Therefore, the 7500 is ~277 cm above the alfalfa field. I also tried swapping the 7500, however, when I installed the replacement 7500 (sn 2176) and uploaded the latest configuration file for that sensor the values were incorrect. Therefore, I re-installed the original 7500 (sn 0065) and brought back the replacement 7500 so that Joe could investigate this further in the lab. 7500 readings: CO2 = 399 ppm (same after cleaning) H2O = 307 mmol m-3 (309 after cleaning) SS = 96.13% (96.45% after cleaning) sos = 347 m s-1 t = 22.20 P = 101.5 kPa Reservoir was also full, so I just topped it off. MET looked good except for some low readings from SHF3 – it reads about half of what the other SHF plates are reading (3.6 vs. ~6). The radiation 10x did not have to be restarted this week. We then drove back to Mayberry to pick up Joe and Cove. |
Veg Height (cm): Tape measure from ground to top of plant
16, 18, 20, 16, 17, 14, 14, 15, 16, 15, 14, 17, 20, 13, 18, 14, 16, 16, 20, 25, avg = 16.7, stdev = 2.87
1 photos found
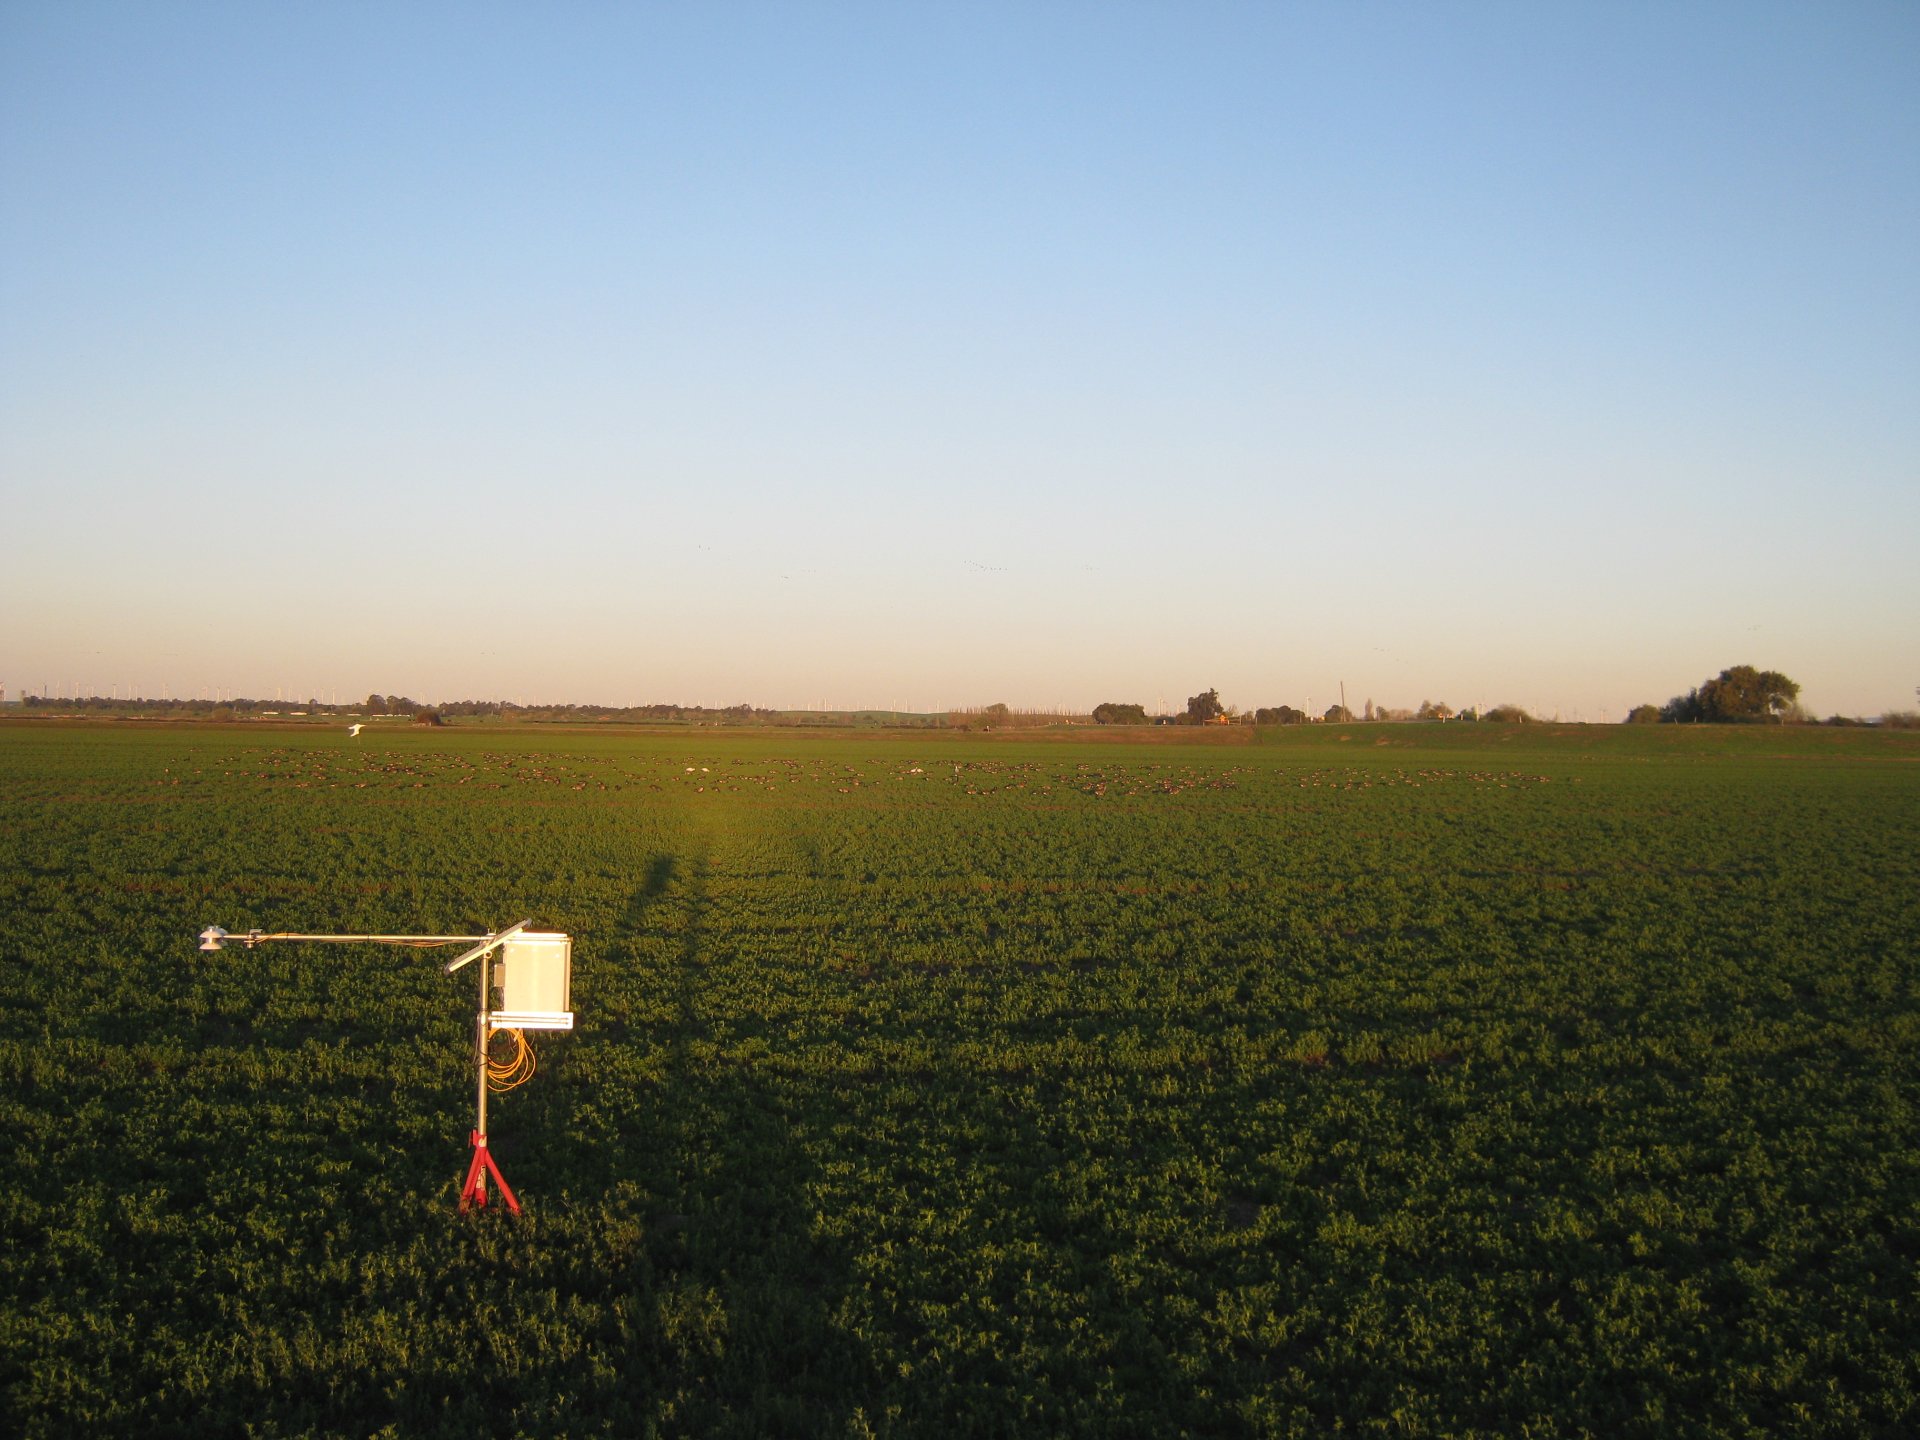
TA_autocam_20140312_0645.jpg ( 2014-03-12 06:45:02 ) Full size: 1920x1440
Geese on the field
7 sets found
Can't check TA_met
11 TA_met graphs found
Can't check TA_rad
3 TA_rad graphs found
Can't check TA_flux
5 TA_flux graphs found
Can't check TA_soilco2
7 TA_soilco2 graphs found
No data found for TA_arable.
1 TA_cam graphs found
Can't check TATWBABCSB_cam