
Field Notes
<--2014-03-07 14:15:00 | 2014-03-19 09:30:00-->Other sites visited today: Sherman Island | Twitchell Rice | East End | West Pond | Twitchell Alfalfa
Phenocam link: Searching...
Mayberry: 2014-03-13 11:15:00 (DOY 72)
Author: Sara Knox
Others: Patty, Cove, Joe
Summary: Data download. Built boardwalk. Moved scaffolding.
| We arrived around 11:15 PDT. It was sunny, windy, and warm. Joe and Cove were hard at work building the boardwalk and moving the scaffolding. I downloaded the data while Patty cleaned the 7700 and 7500. We also measured the instrument heights: 7700 Height: 304 cm 7500 Height: 303.5 cm 7500 readings: CO2: 402 ppm (same after cleaning) H2O: 360 mmol m-3 (345 after cleaning) signal strength = 93.1% (93.6% after cleaning) t: 20.0 °C p = 101.6 kPa sos = 343 m s-1 Current 7700 readings: CH4 = 1.96 ppm (1.99 after cleaning) RSSI = 54% (86% after cleaning) Reservoir was full. Didn’t top off. We downloaded the Met data after we came back in the afternoon to pick up Cove and Joe (around 3:45 PDT) Joe and Cove built a 30 foot boardwalk running roughly north-south just to the east of the current flux tower location. We pulled all sensors and structure (except for one fence post) from the Tule tower location. The scaffolding was rebuilt at the end of the new boardwalk. All thermocouples were removed for retrofit but the other equipment was reinstalled on the scaffolding. Substantial rewiring and remounting will be needed when the flux equipment is moved to the scaffolding. |
7 photos found

20140313MB_Boardwalk.jpg ( 2014-03-13 15:41:17 ) Full size: 1920x1440
Scaffolding moved to end of new 30' boardwalk
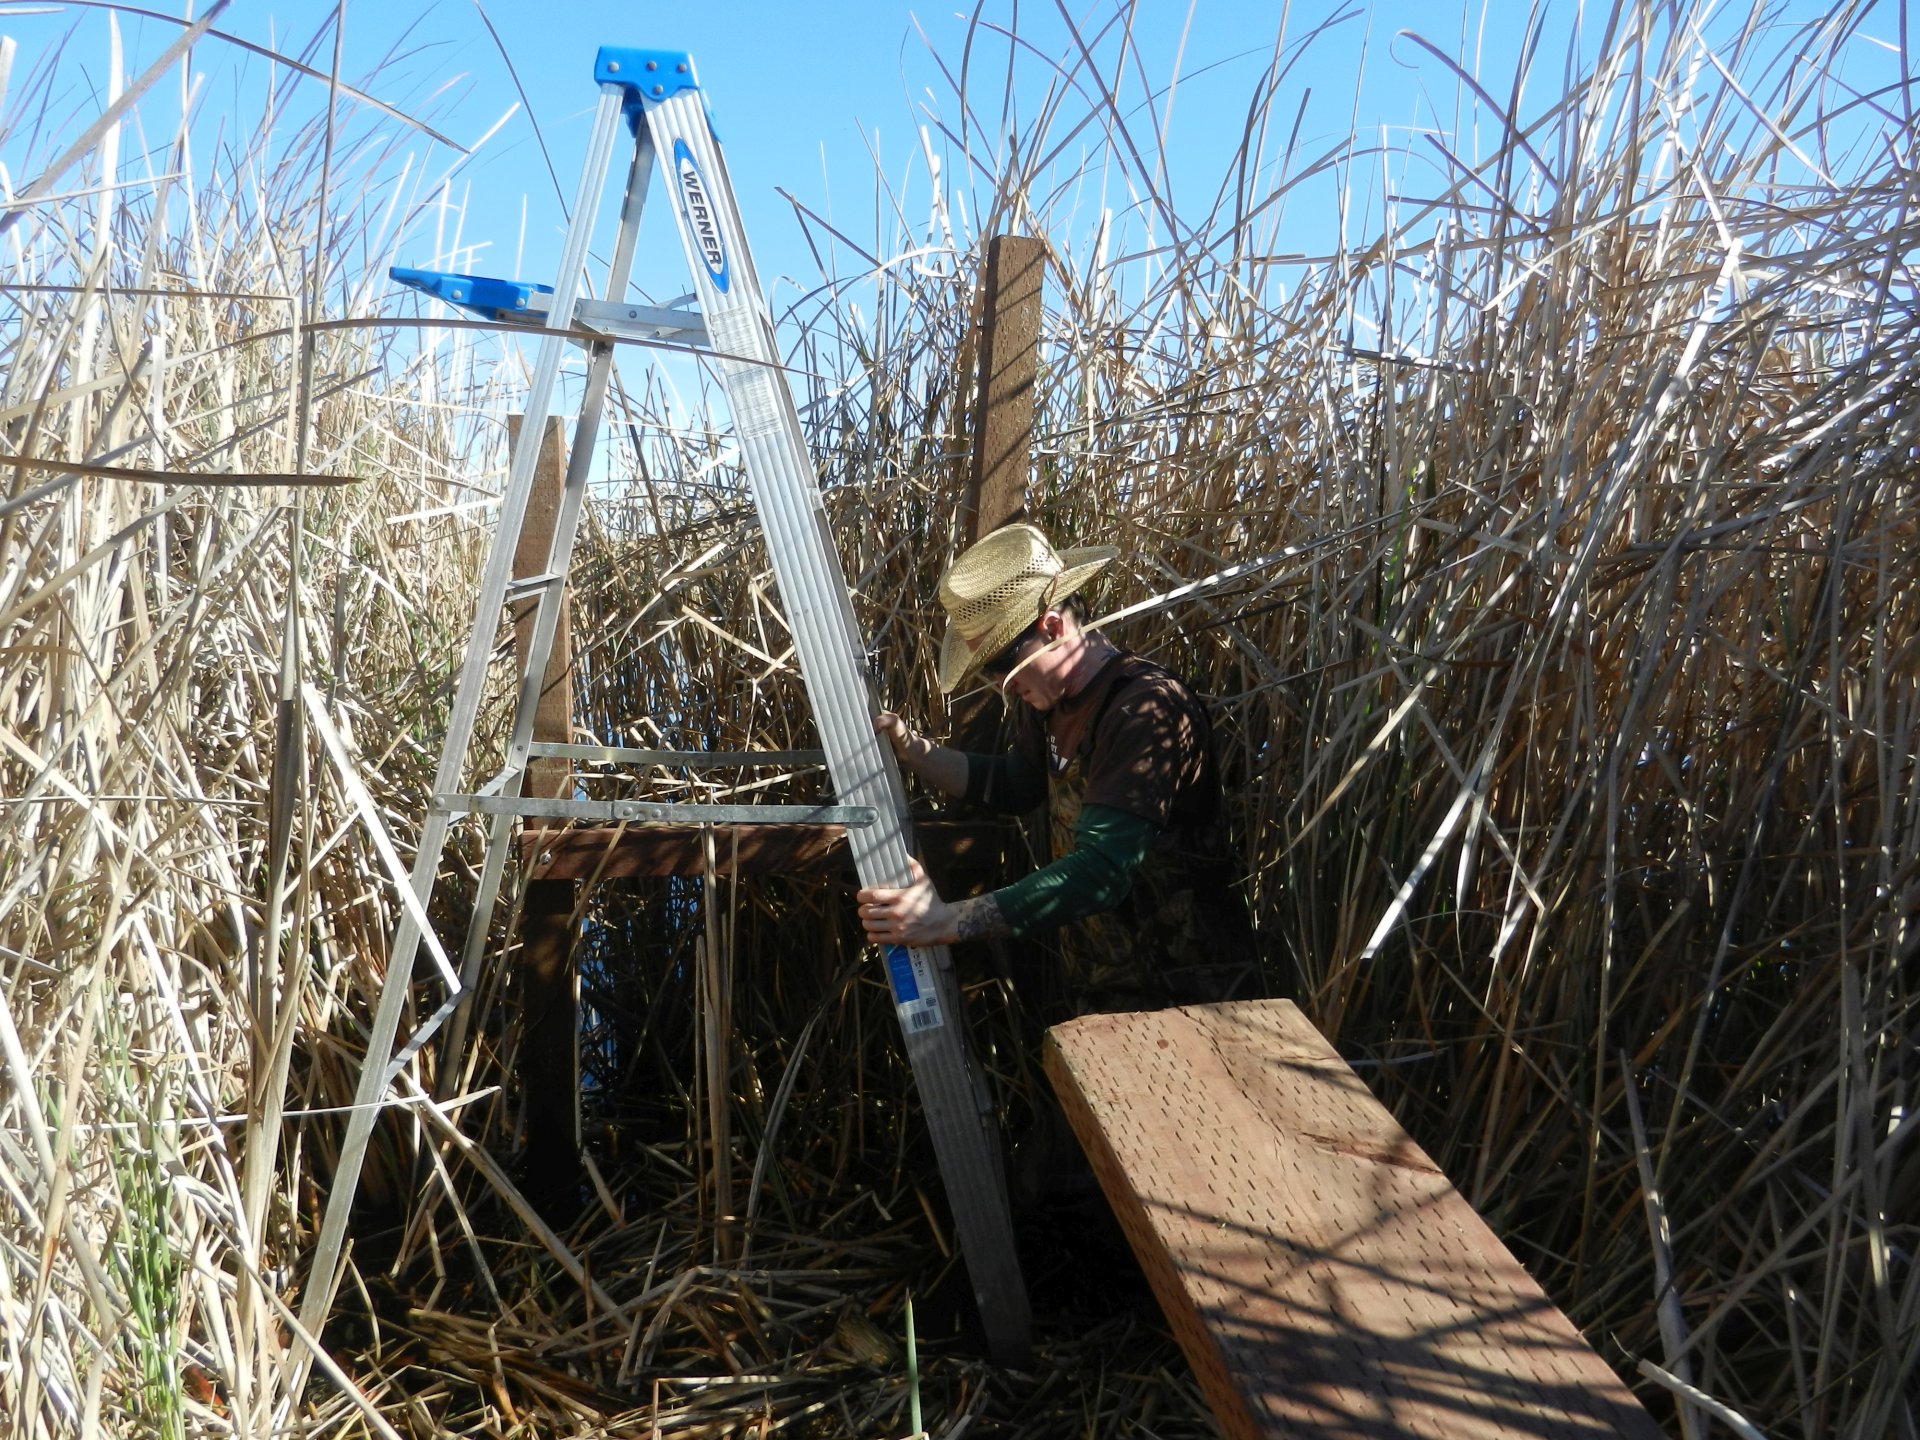
20140313MB_CoveBuildingBoardwalk.jpg ( 2014-03-13 10:38:13 ) Full size: 1920x1440
Cove working on the boardwalk
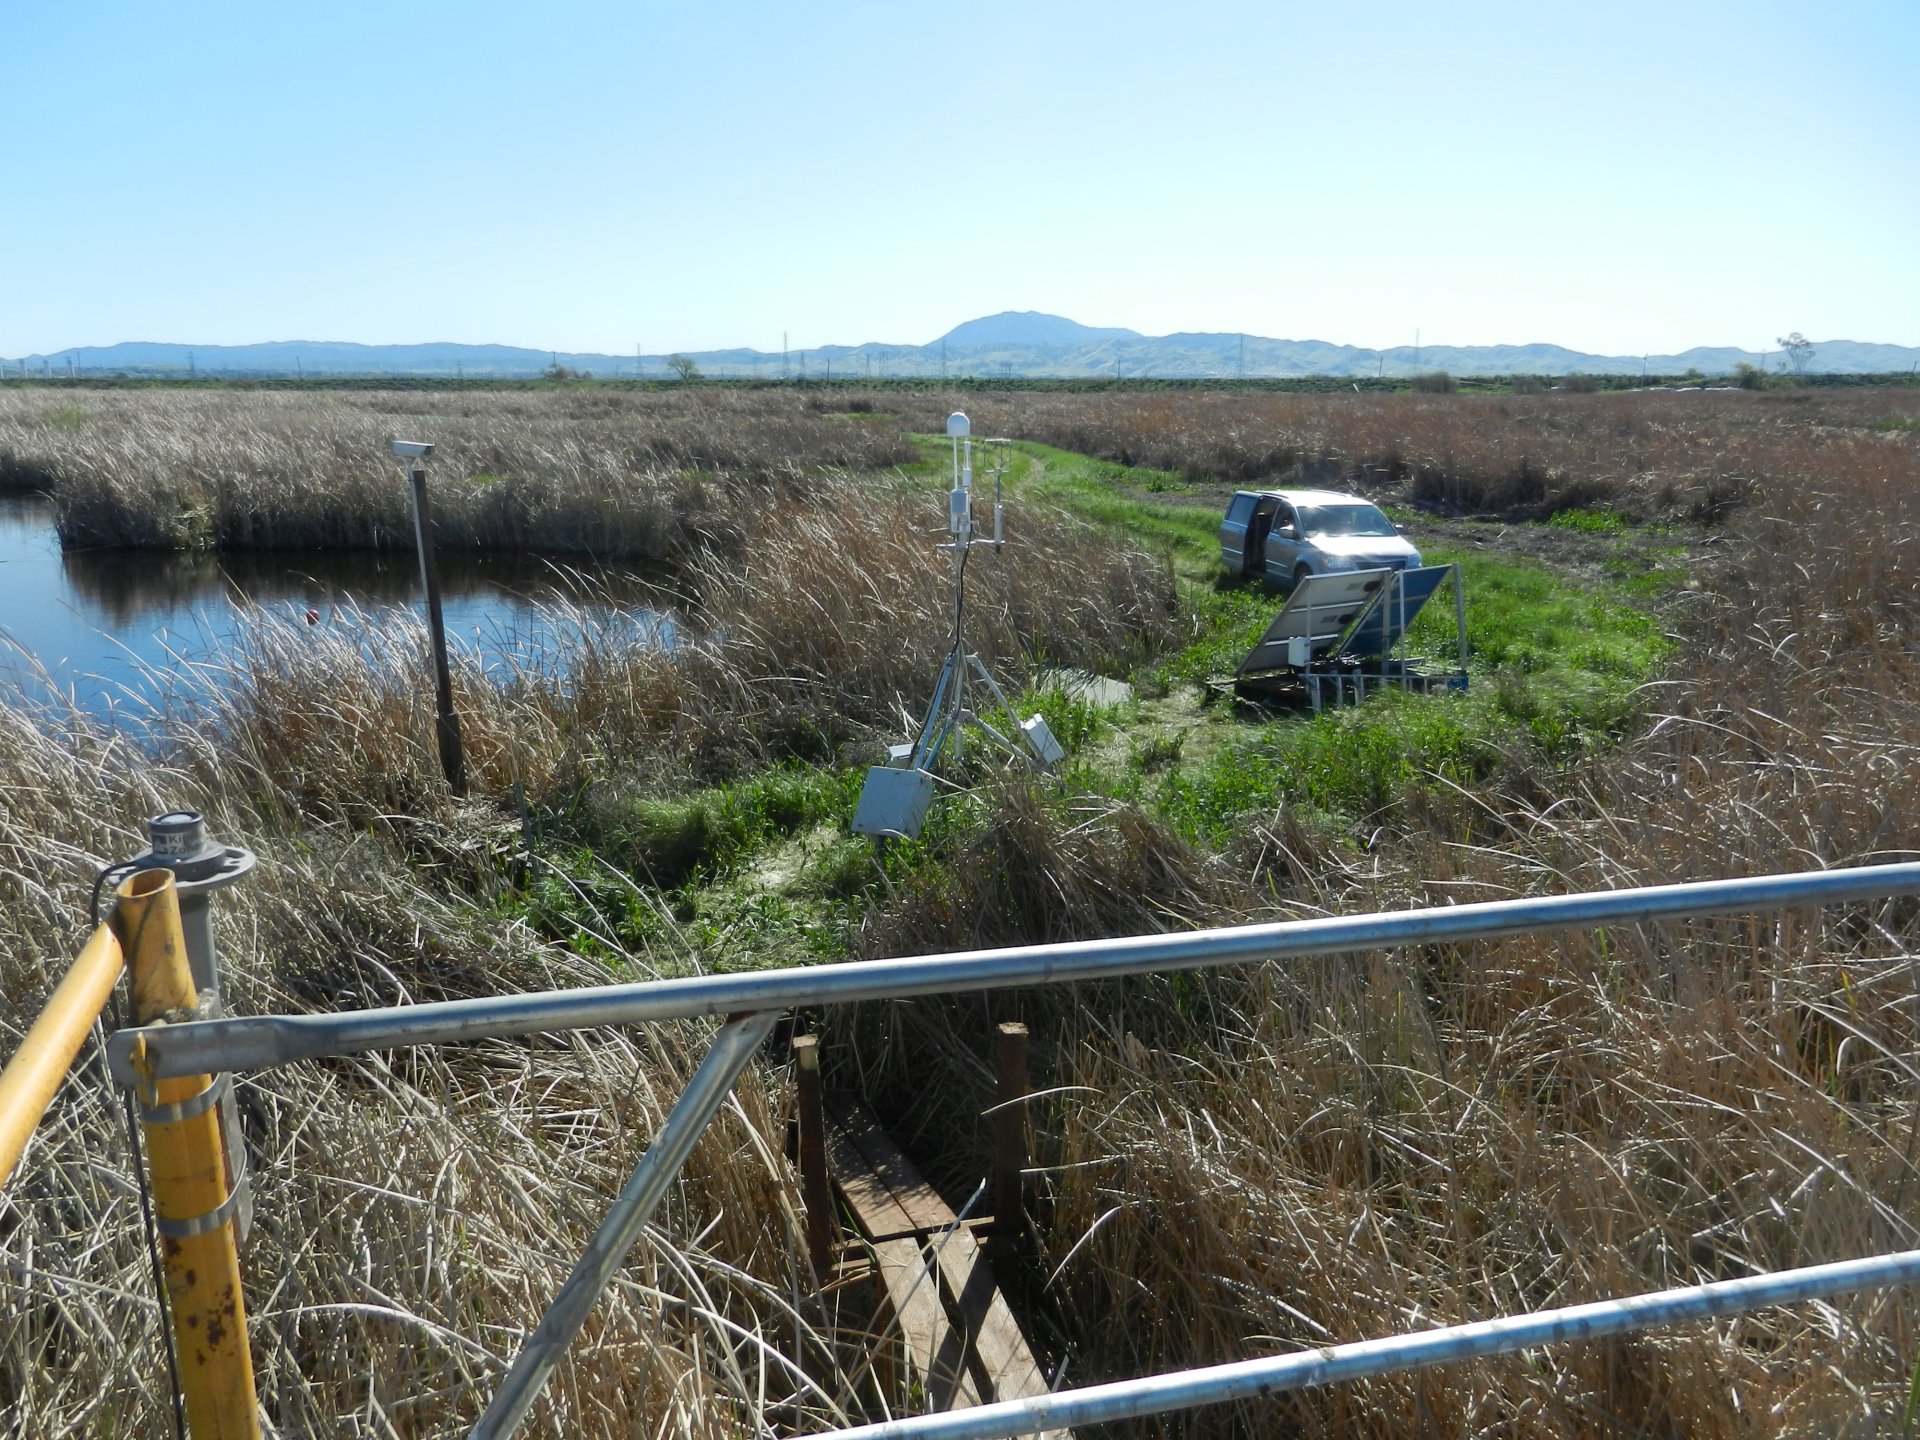
20140313MB_SiteFRomScaffolding.jpg ( 2014-03-13 15:40:49 ) Full size: 1920x1440
View from top of tower
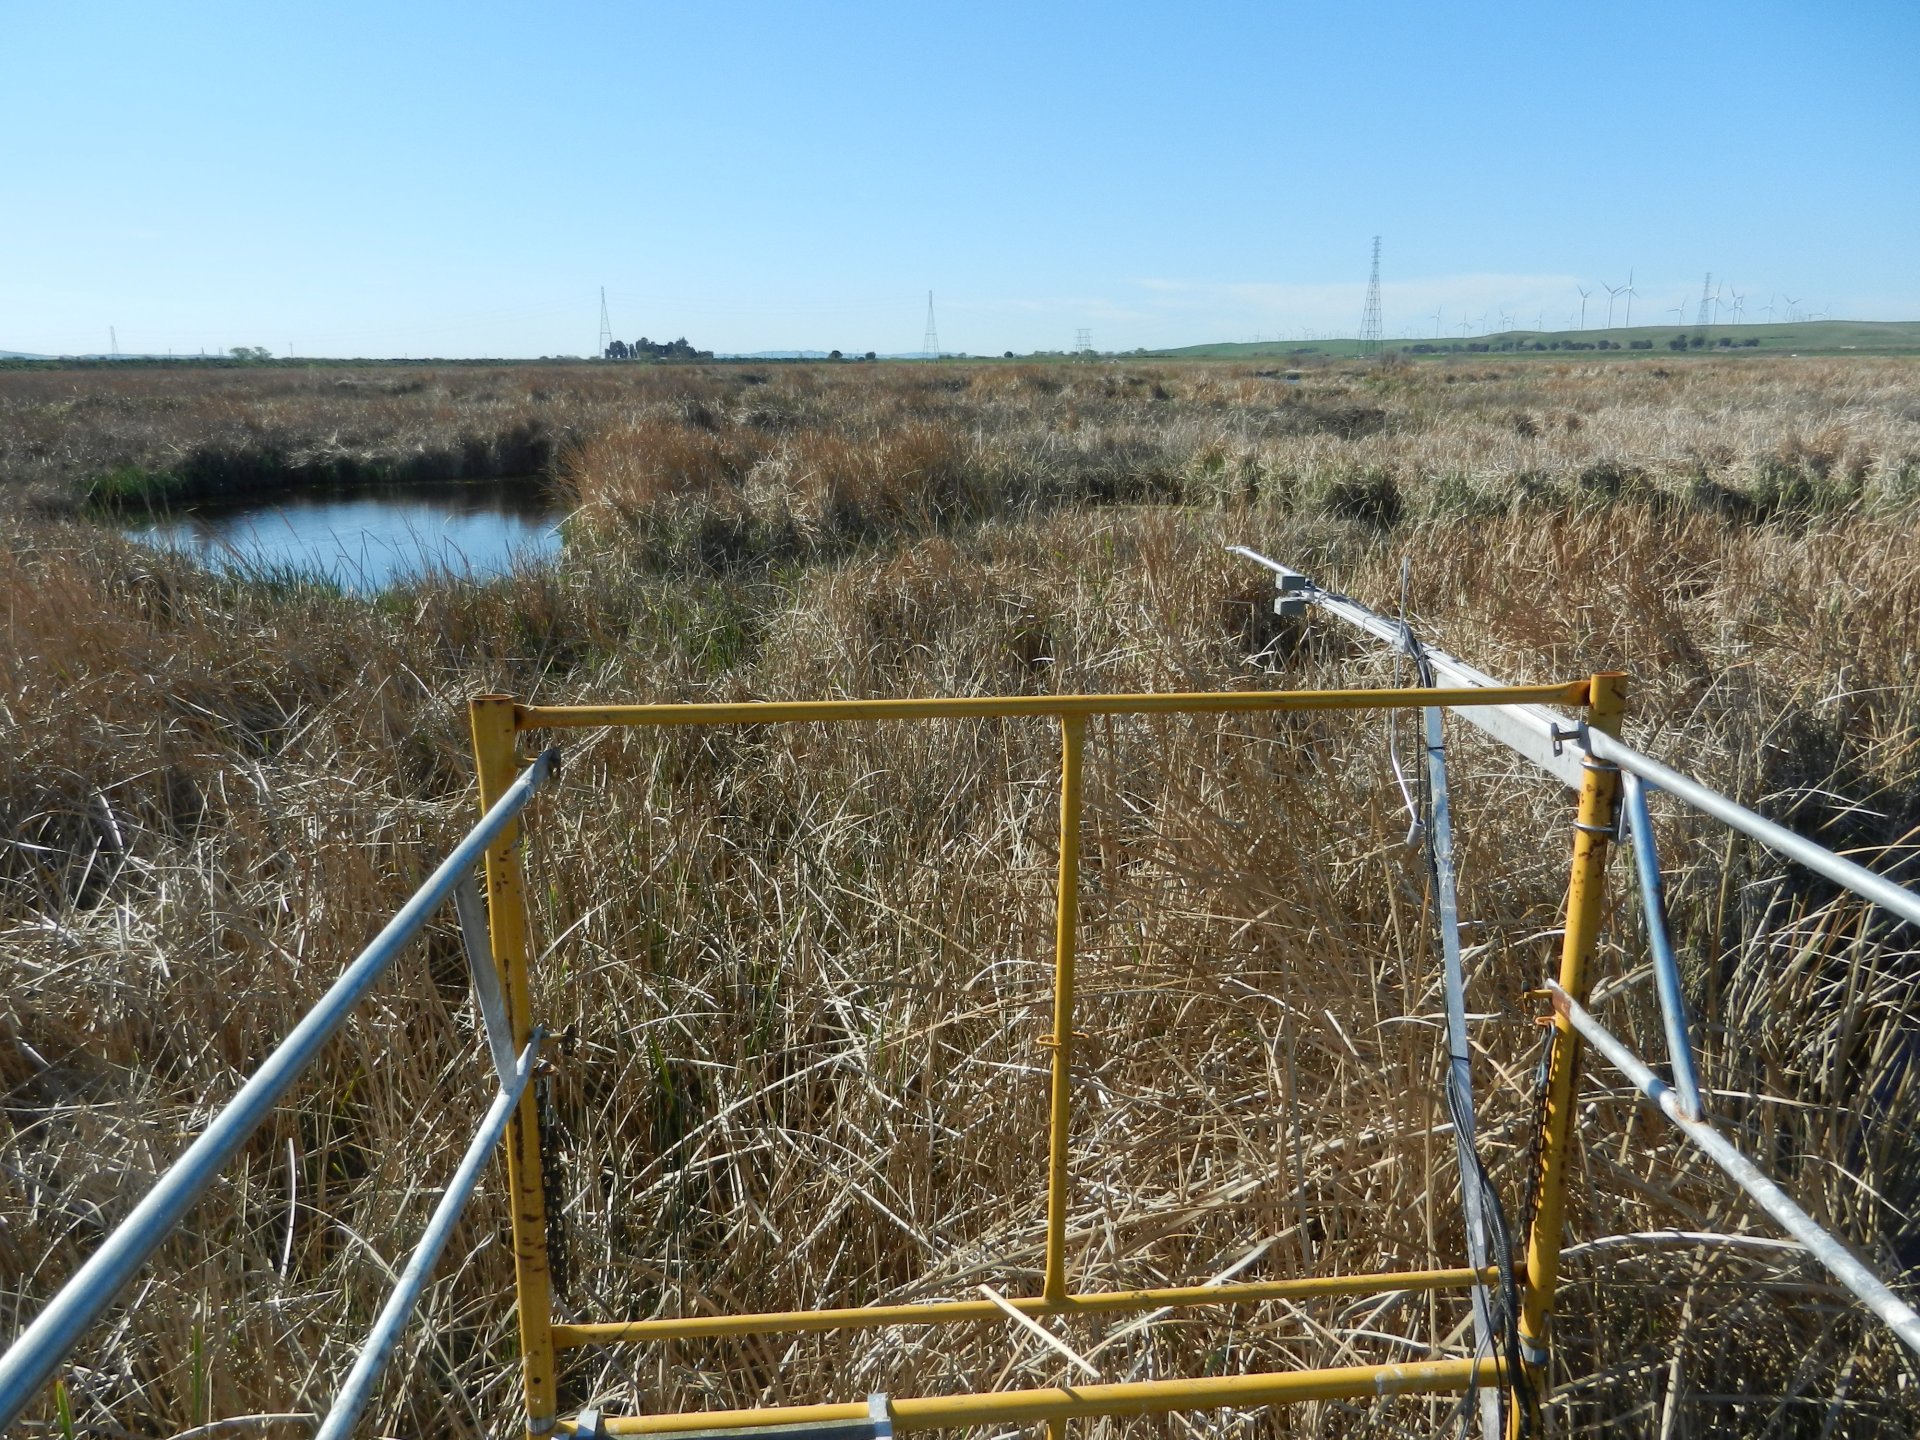
20140313MB_ViewFromScaffolding.jpg ( 2014-03-13 15:40:41 ) Full size: 1920x1440
View from top of tower
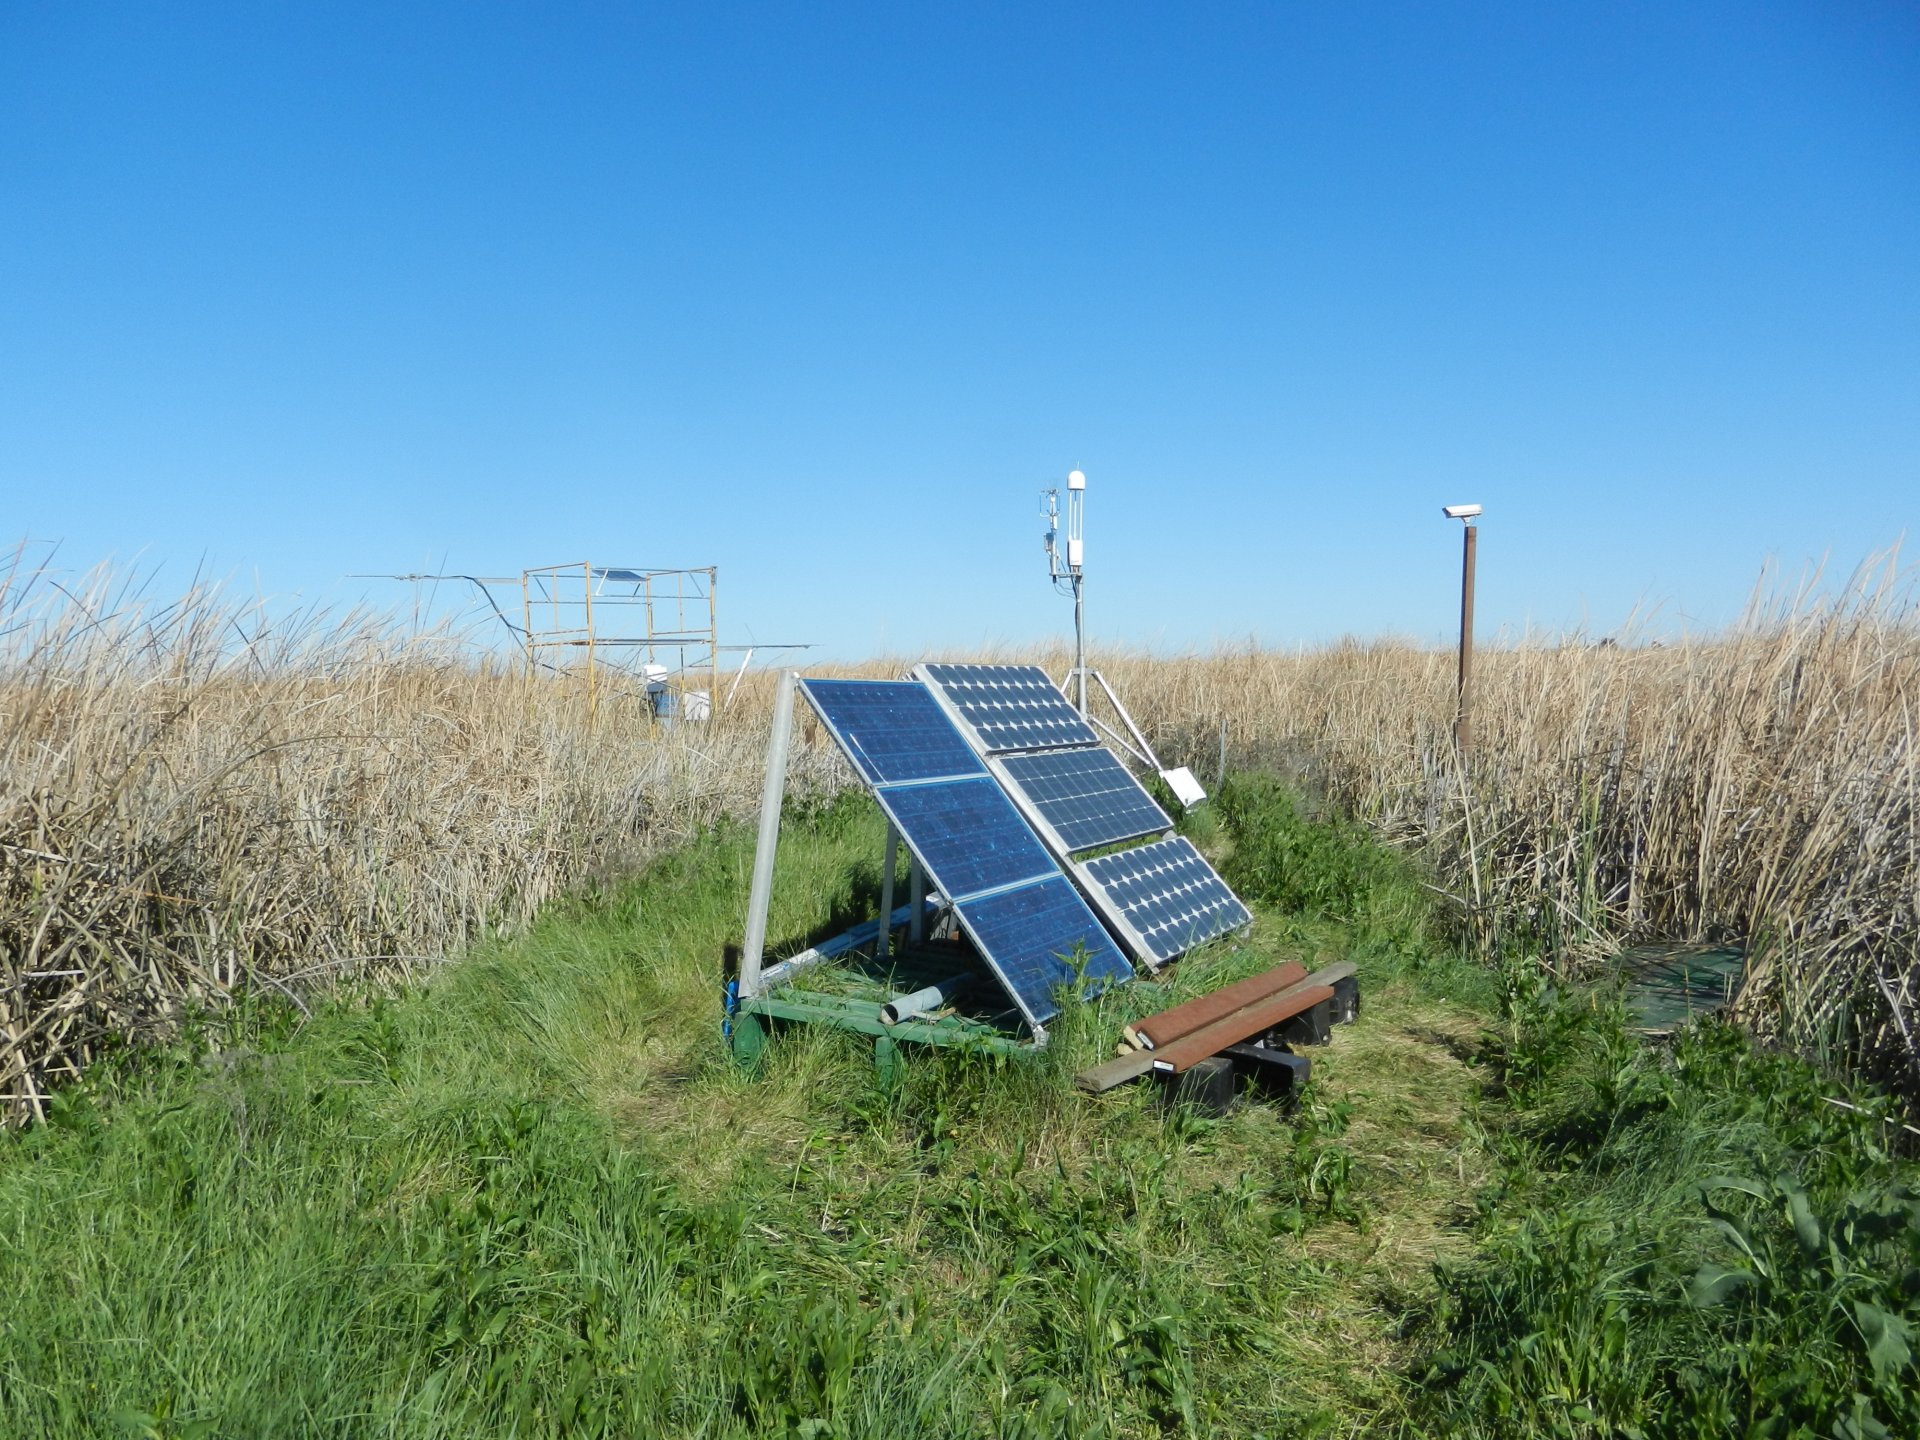
20140313MB_SiteWithScaffolding.jpg ( 2014-03-13 15:39:22 ) Full size: 1920x1440
Solar panels with new scaffolding tower in the background

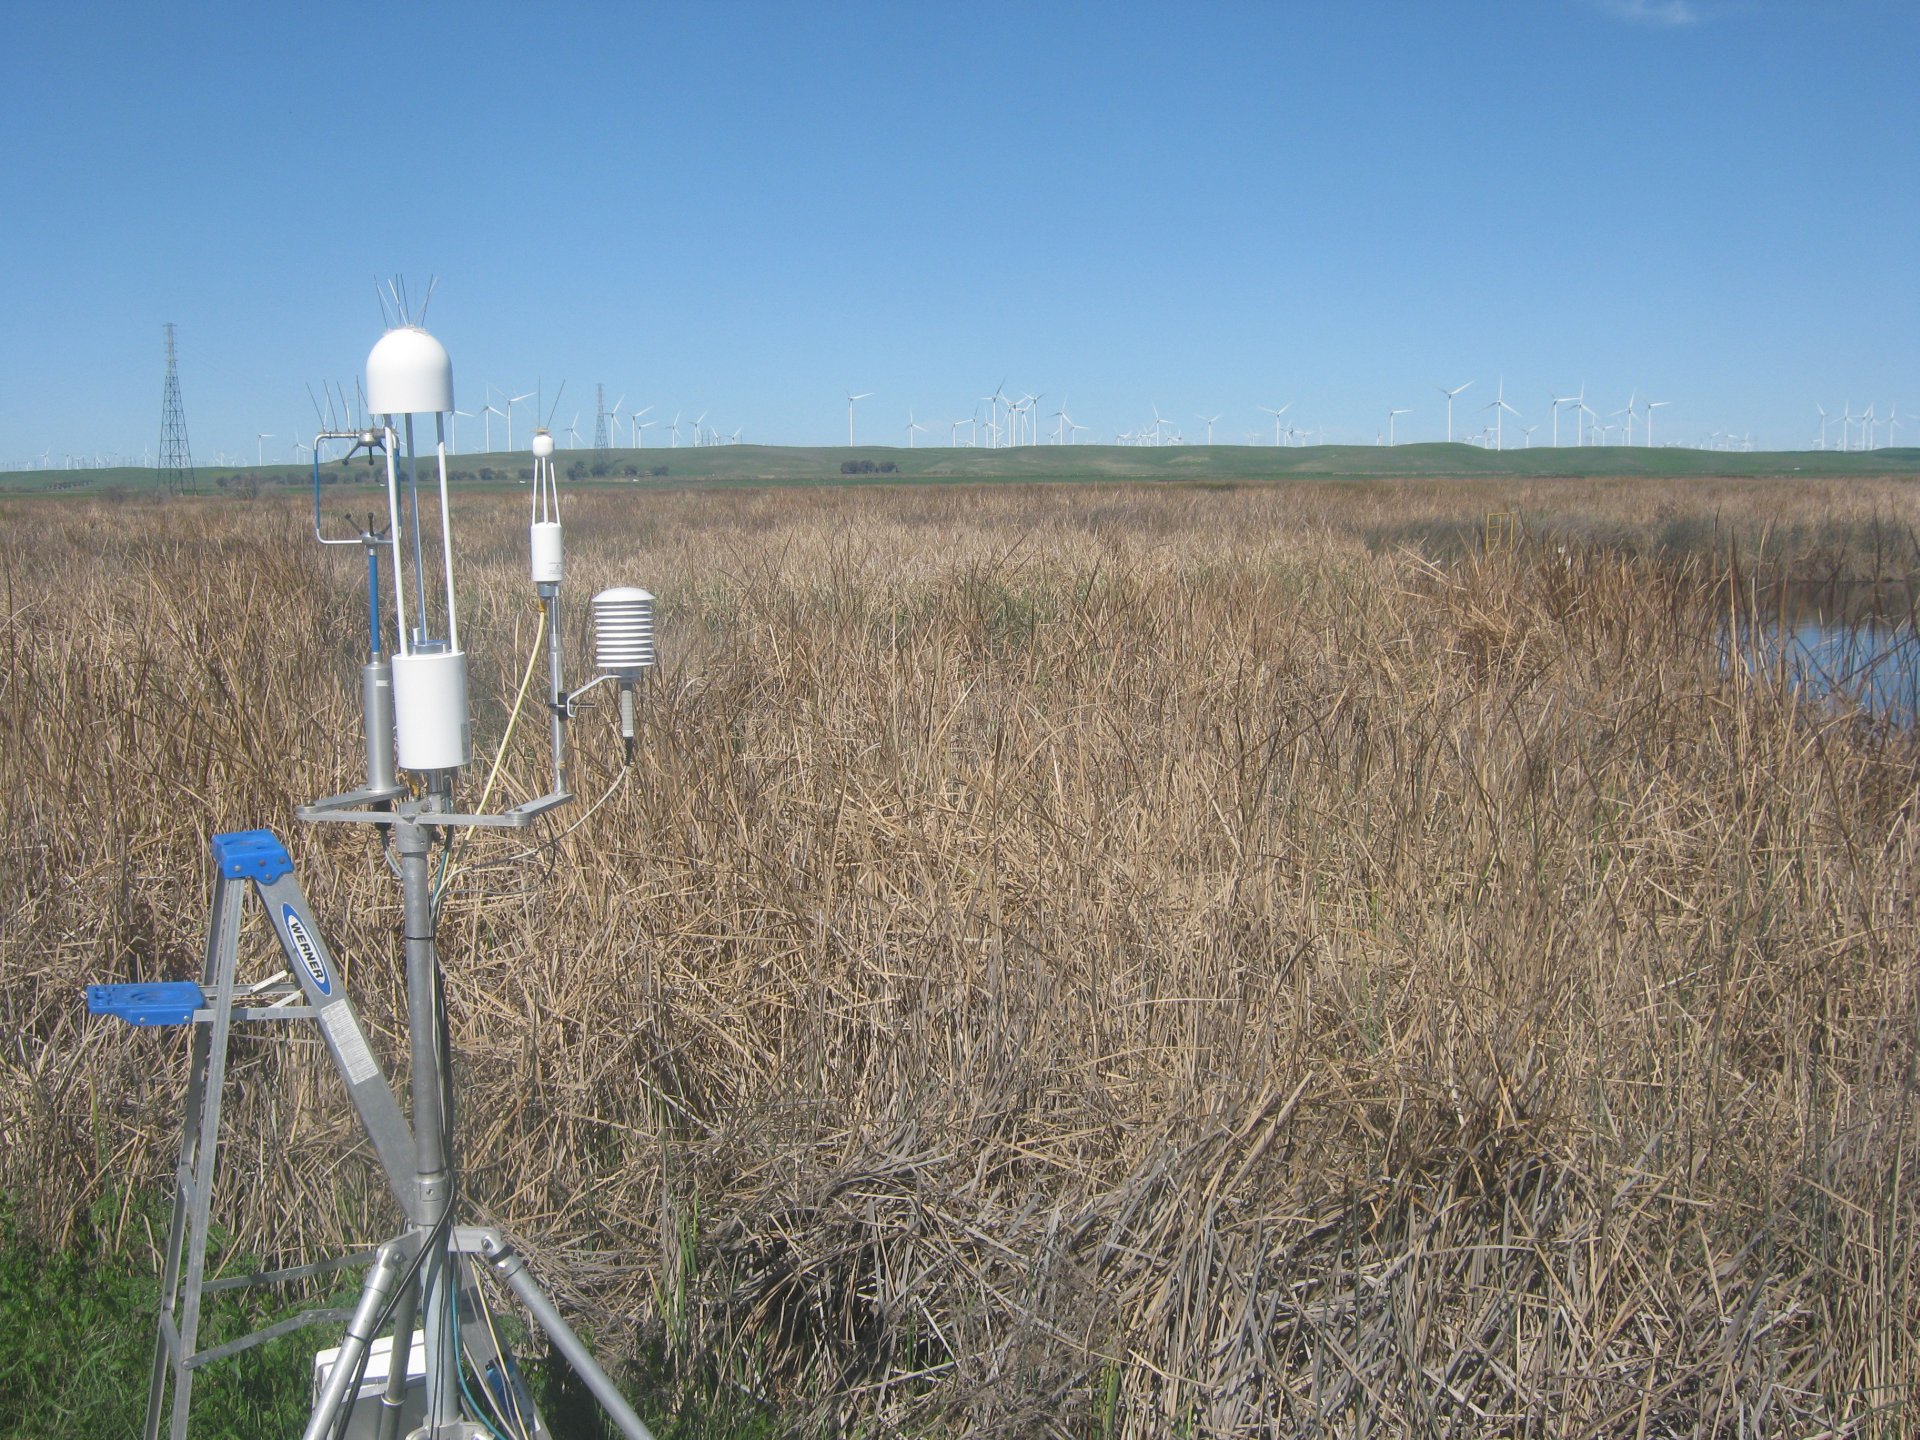
MB_autocam_20140313_1115.jpg ( 2014-03-13 11:15:02 ) Full size: 1920x1440
Moving tule tower
MB_autocam_20140313_1215.jpg ( 2014-03-13 12:15:02 ) Full size: 1920x1440
Tule tower moved
11 sets found
7 MB_flux graphs found
No data found for MB_met.
28 MB_tule graphs found
Can't check MBWPEESWGT_mixed
1 MB_cam graphs found
Can't check MBEEWPSWEPGT_cam
Can't check SIMBTWEE_met
No data found for MB_minidot.
Can't check MBSWEEWPBCBA
1 MB_processed graphs found
Can't check MB_fd
1 MB_fd graphs found