Field Notes
<--2013-11-06 09:25:00 | 2013-12-06 11:10:00-->Other sites visited today: Mayberry | Twitchell Rice | DWR Corn | West Pond | Twitchell Alfalfa
Phenocam link: Searching...
Sherman Island: 2013-11-21 08:15:00 (DOY 325)
Author: Cove Sturtevant
Others: Laurie
Summary: PG&E turned off power due to non-payment. Should be up shortly. Data download. Some fieldwork.
| Sherman 2013-11-21 We arrived about 08:15 PST. It was cold, super windy, and overcast. The field was muddy due to the recent rains. We arrived to find the main power off (although the CO2 flux system was still running on battery). After some investigation and a chat with Joe it was determined that PG&E shut off the power due to non-payment. Good timing of our arrival! Apparently payment and power reinstatement should happen shortly. Without power, our trip was limited, so I cleaned the instruments and downloaded flux and autocam data while Laurie did well depth, moisture point, and a veg height transect. No spectral measurements -- after coming back from calibration, the spectrometer head didnt make it back into the equipment we grabbed for today. |
Veg Height (cm): Tape measure from ground to top of plant
0, 53, 0, 37, 1, 10, 0, 30, 2, 2, 40, 40, 1, 0, 0, 1, 40, 70, 0, 38, avg = 18.3, stdev = 22.56
2 photos found

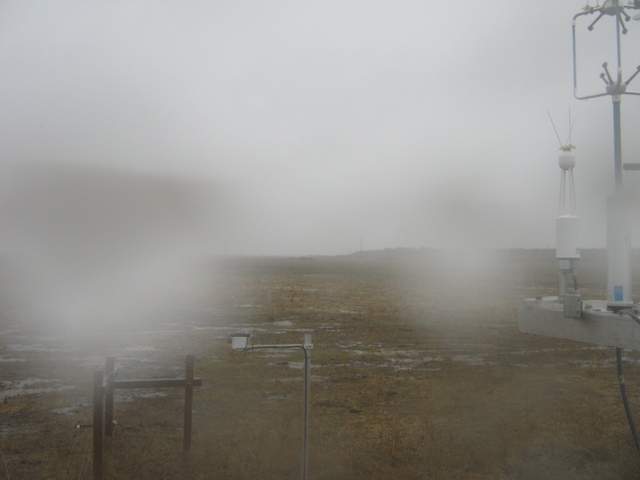
SI_autocam_20131120_1245.jpg ( 2013-11-20 12:45:03 ) Full size: 1920x1440
Rain at Sherman

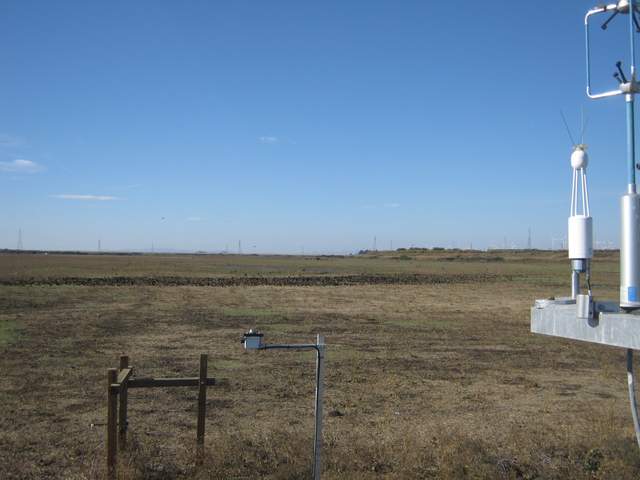
SI_autocam_20131121_1315.jpg ( 2013-11-21 13:15:02 ) Full size: 1920x1440
Flock of birds
7 sets found
No data found for SI_mp.
11 SI_met graphs found
Can't check SI_mixed
2 SI_mixed graphs found
4 SI_flx graphs found
3 SI_soilco2 graphs found
Can't check TWSI_mixed
Can't check SIMBTWEE_met

