
Field Notes
<--2013-10-16 08:30:00 | 2013-11-21 08:15:00-->Other sites visited today: Mayberry | Twitchell Rice | DWR Corn | West Pond | Twitchell Alfalfa
Phenocam link: Searching...
Sherman Island: 2013-11-06 09:25:00 (DOY 310)
Author: Cove Sturtevant
Others: Sara, Patty
Summary: Standard fieldwork and data download. Swapped out power supply for soil CO2 system.
| Sherman 2013-11-06 We arrived about 09:25 PST. It was cool, calm, and sunny but hazy. The site is brown and trampled. The ditch running east-west to the north of the tower was muddy with only standing water in footprints. I attended to the tower and downloaded data while Patty did soil CO2 flux and Sara did moisture point and well depth. I took a veg height transect at the end. No spectral measurements, the OceanOptics spectrometer was still out for calibration. LGR readings: 2.46 ppm, 09:29, 24.9 C, 129.2 Torr (adjusted to 146.8 Torr), 12.52 us, 10 Hz 7500 readings: CO2: 17.7 mmol m-3 (17.9 after cleaning) H2O: 378 mmol m-3 (360 after cleaning) diag: 248 (247 after cleaning) p: 102.7 kPa t: 18.6 C sos: 341.0 m s-1 MET looked good. Cleaned radiation instruments. I swapped out the 24V power supply for the soil CO2 system (connected through a solar controller with battery backup) with a variable voltage power supply. I adjusted the new power supply voltage so that the battery voltage was reading 26.2V and the charging current was 0.9A. The system seemed happy after the swap (the battery voltage indicator on the controller turned from blinking red to yellow). |
Veg Height (cm): Tape measure from ground to top of plant
0, 0, 40, 0, 3, 37, 4, 5, 3, 46, 2, 29, 14, 1, 3, 16, 4, 6, 21, 20, avg = 12.7, stdev = 14.72
1 photos found
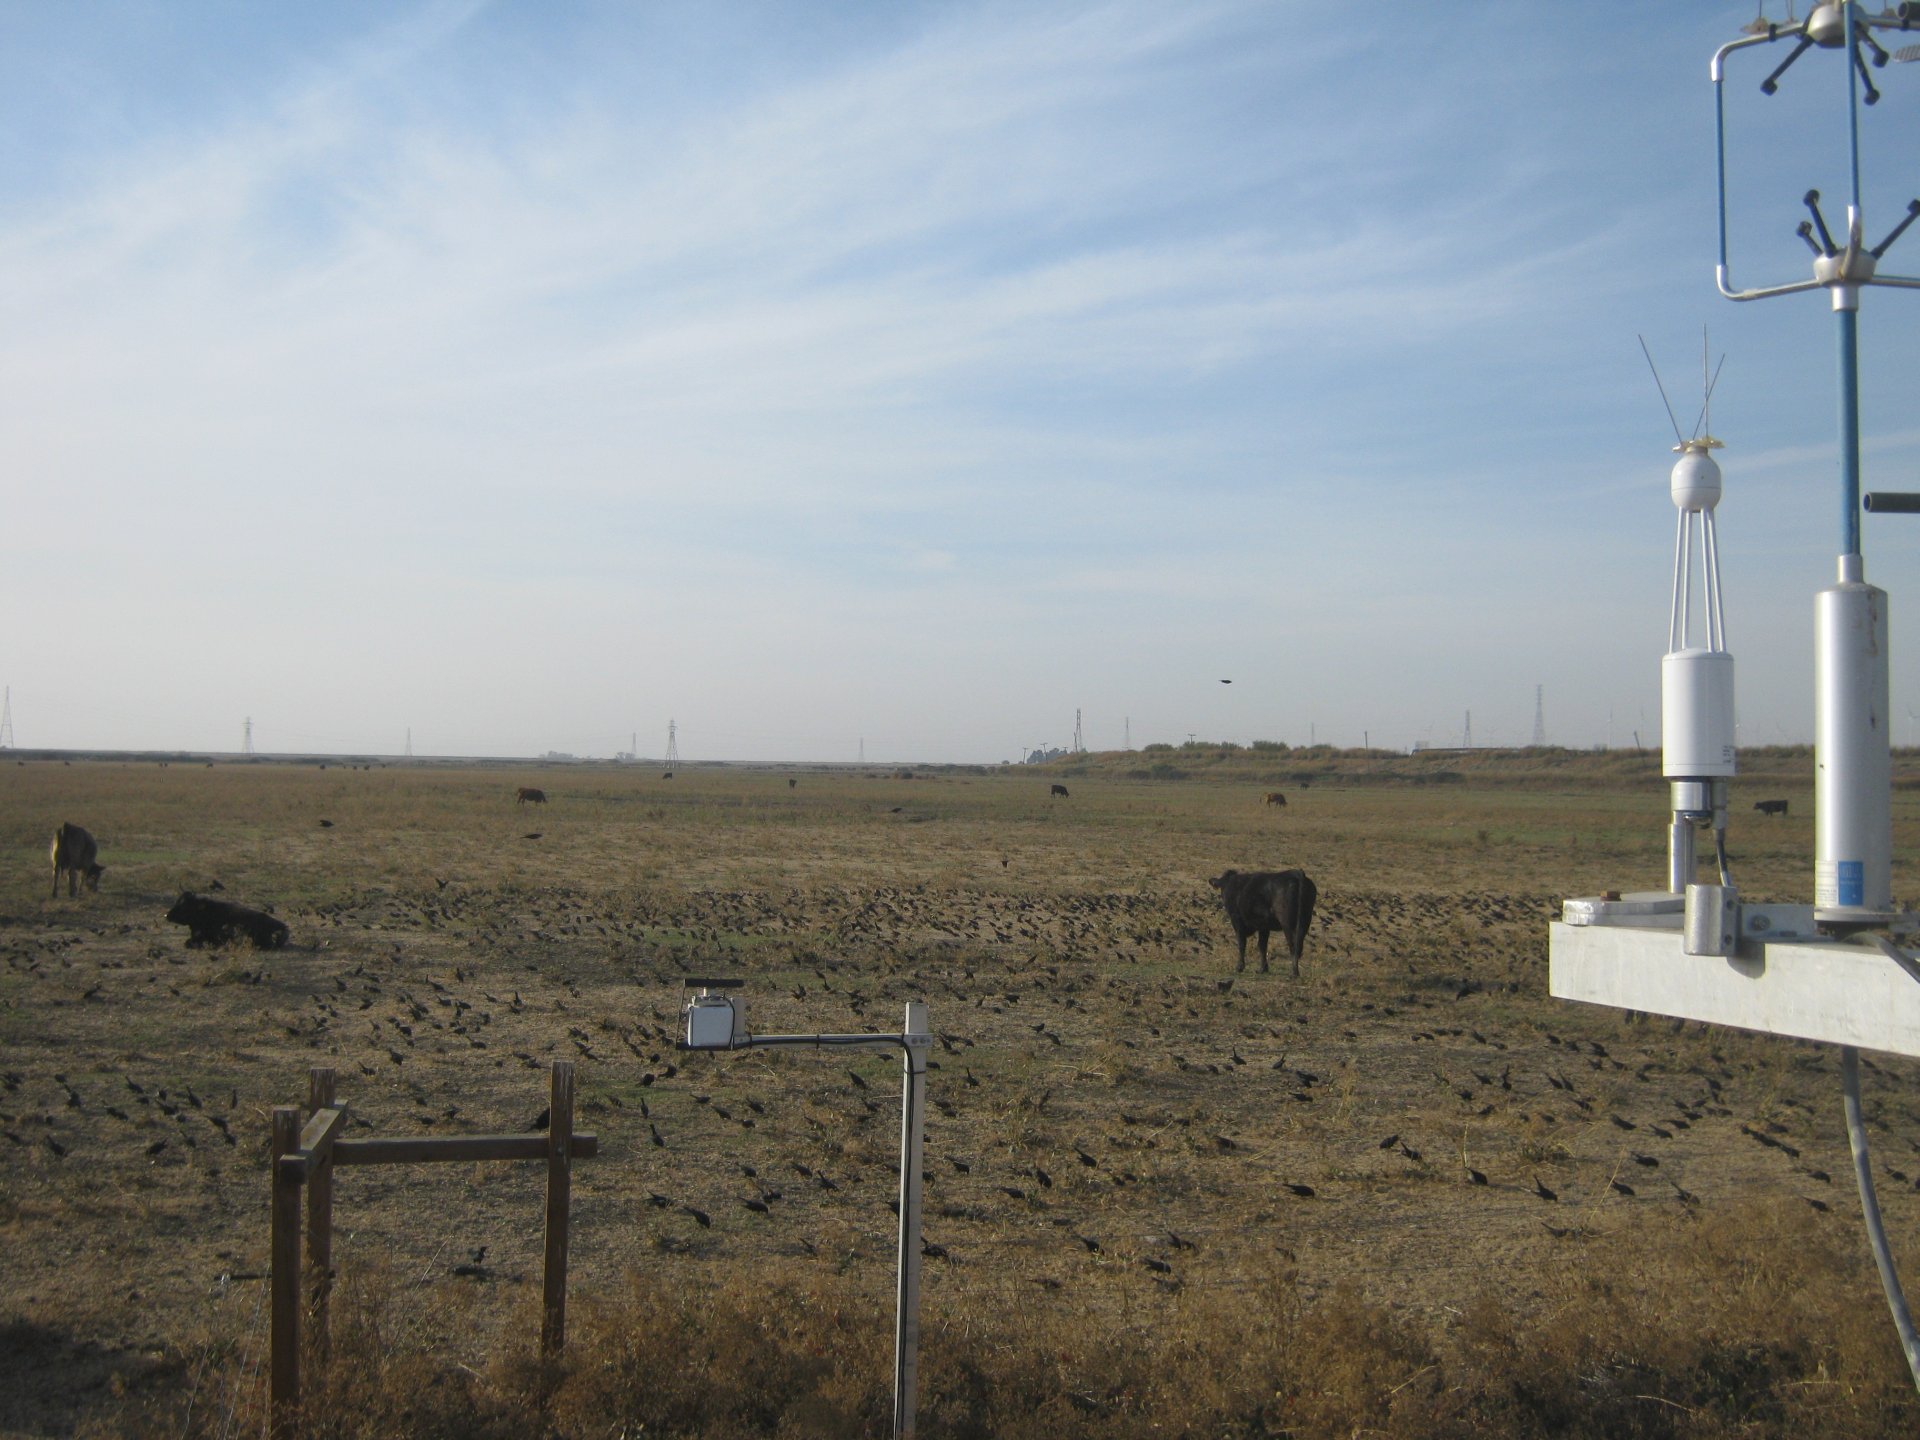
SI_autocam_20131106_1515.jpg ( 2013-11-06 15:15:02 ) Full size: 1920x1440
Cows and birds
7 sets found
No data found for SI_mp.
11 SI_met graphs found
Can't check SI_mixed
2 SI_mixed graphs found
4 SI_flx graphs found
3 SI_soilco2 graphs found
Can't check TWSI_mixed
Can't check SIMBTWEE_met