
Reports
Contents
| Title: | HMP RH and AirT Comparison 12-2017 | |||||||||||||||||||||||||||||||||||||||||||||||||||||||||||||||||||||||||||||||||||||||||||||||||||||||||||||||||||||||||||||||||||||||||||||||||||||||||||||||
| Date: | 2017-12-18 | |||||||||||||||||||||||||||||||||||||||||||||||||||||||||||||||||||||||||||||||||||||||||||||||||||||||||||||||||||||||||||||||||||||||||||||||||||||||||||||||
| Data File: | HMPCompare_201712.csv HMPCompare_201801.csv |
|||||||||||||||||||||||||||||||||||||||||||||||||||||||||||||||||||||||||||||||||||||||||||||||||||||||||||||||||||||||||||||||||||||||||||||||||||||||||||||||
| Refers to: | TA,EE,WP,SW,MB,W07030036,G4540021,U3030041,G45400253,G4540025,L1740420,T2130005,L2310736,U2120013,L2310711,U3030046,T1250012 | |||||||||||||||||||||||||||||||||||||||||||||||||||||||||||||||||||||||||||||||||||||||||||||||||||||||||||||||||||||||||||||||||||||||||||||||||||||||||||||||
|
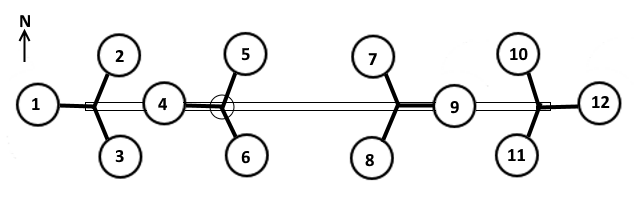
From 2017-12-18 to 2017-12-19, twelve HMP45s and HMP60s were compared at the Twitchell Alfalfa site. There was one reference (master) sensor. For more details about setup, see field notes from 2017-12-18, 2017-12-19, 2018-01-11, 2018-01-16, and 2018-01-31. All sensors were set up on the N side of the tower, under the flux sensors. Sensors 4, 5, 6 are on the eddy post. The other 9 sensors are on a separate metal bar.
Air temperature data generally matched within specifications: +/-0.6C (HMP60) and +/-0.5C (HMP45). The TA sensor was ~1C warmer and the SW sensor was ~2-3C cooler than the other sensors. Figure 1. Time series of air temperatures. Relative humidity data generally matched within specifications: +/-5% (HMP60) and +/-3% (HMP45). Figure 2. Time series of relative humidity Linear regressions for air temperature and relative humidity between the master and test sensors had tight lines; the only exception was air temperature data from the SW sensor.
Figure 3. Linear Regressions for air temperature.
Figure 4. Linear Regressions for relative humidity. From 2018-01-11 to 2018-01-31, two sensors were compared at the Twitchell Alfalfa site. From 2018-01-11 to 2018-01-16, the sensors had no fans and were not aspirated. (Missing data from this period was caused by sporadic power outages at the site.) On 2018-01-16, we added new 24V fans to both sensors to collect aspirated data. Aspirating the sensors made more of a difference for air temperature data than relative humidity data. When not aspirated, the two sensors did not necessarily match with air temperature specifications: measurement difference was 1.5-2.5 degC. However, when aspirated, the air temperature difference between the two sensors was 0.6-1 degC, meeting the specification of +/- 0.6 degC. Figure 5. Time series of aspirated vs. non-aspirated air temperature. Aspiration made less difference for relative humidity measurements. Without aspiration, the two relative humidity measurements were about 5% different; with aspiration, the two measurements were about 4% different. Figure 8. Time series of aspirated vs. non-aspirated relative humidity. There is a slight offset difference between aspirated vs. non-aspirated air temperature. However, the regression lines are right on top of each other for aspirated vs. non-aspirated relative humidity, again showing that aspiration affects air temperature but not relative humidity data.
Figure 7. Linear regressions for aspirated vs. non-aspirated air temperature.
Figure 6. Linear regressions for aspirated vs. non-aspirated relative humidity. Â Â |
||||||||||||||||||||||||||||||||||||||||||||||||||||||||||||||||||||||||||||||||||||||||||||||||||||||||||||||||||||||||||||||||||||||||||||||||||||||||||||||||
| |