Field Notes

<--2012-08-23 11:45:00 | 2012-09-06 09:00:00-->
Other sites visited today: Sherman Island | Twitchell Rice | DWR Corn | Twitchell Rice | West Pond
Phenocam link: Searching...

Mayberry: 2012-08-30 13:00:00 (DOY 243)
Author: Jaclyn Hatala
Others: Joe, Emily Gilson

Summary: everything OK, Emily took water samples

Arrived at the site around 1pm local time. A slight breeze compared with the Twitchell Island sites, although still quite warm.

All looked well at the flux tower. We downloaded flux and met data as well as the digital camera photos. LI-7700 RSSI was 41 upon arrival, and 87 after cleaning. Emily Gilson took an increased number of replicates (5 at each spatial location in the wetland) of water samples for CO2 & CH4 analysis back in the lab. I gave the solar panels a wash while waiting for Emily to finish sampling.

CH4 = 2.0 ppm
CO2 = 392 ppm
H2O = 670 mmol/m3
SOS = 350 m/s

Joe moved the portable tower while we were finishing up at the permanent site. All’s well with that tower too. LI-7700 RSSI was 50 after moving the sensor, we forced it to wash itself and it bumped up to 57. We downloaded flux data.

CH4 = 1.98 ppm
CO2 = 382 ppm
H2O = 600 mmol/m3
SOS = 350 m/s

1 photos found

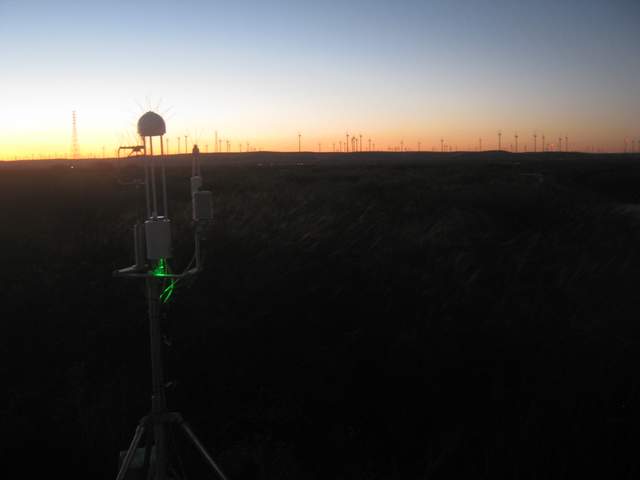
Nice light after sunset
MB_autocam_20120830_2015.jpg ( 2012-08-30 20:15:04 ) Full size: 1920x1440
Nice light after sunset

Graphs display:
11 sets found

7 MB_flux graphs found

Explore the graph:Sonic Wind in a new window

Explore the graph:LI7700 mV signals in a new window

Explore the graph:Counts in a new window

Explore the graph:LI7700 CH4 from analog signal in a new window

Explore the graph:LI7500 CO2 and H2O in a new window

Explore the graph:LI7700 CH4 from digital signal in a new window

Explore the graph:CO2 in ppm in a new window

No data found for MB_met.
27 MB_tule graphs found

Explore the graph:MB Tule Tower: Open Water 2 (3/1/11-3/23/17) in a new window

Explore the graph:MB Tule Tower: Open Water 1 (3/1/11-2/21/13) in a new window

Explore the graph:MB Tule Tower: Tule Temps 2 & 3 (3/1/11-3/19/14) in a new window

Explore the graph:MB Tule Tower: Tule Temps 1 (3/1/11-3/19/14) in a new window

Explore the graph:Mayberry Tule Tower: Solar Radiation in a new window

Explore the graph:Mayberry Tule Tower: Disolved Oxygen in a new window

Explore the graph:Mayberry Tule Tower: IRT and Sensor Temp in a new window

Explore the graph:Mayberry Tule Tower: Volts and RH in a new window

Explore the graph:LED NDVI Sensor in a new window

Explore the graph:Water CO2 in a new window

Explore the graph:Water Pressure in a new window

Explore the graph:Fluorometer Data in a new window

Explore the graph:Mayberry pCO2 Profile in a new window

Explore the graph:Water Temperatures in a new window

Explore the graph:Air Temperatures in a new window

Explore the graph:Air Pressure in a new window

Explore the graph:4-Way Radiometer in a new window

Explore the graph:MB Tule Tower: Open Water 1 (2/21/13-3/19/14) in a new window

Explore the graph:MB Tule Tower: Tule Temps 1 (3/19/14-now) in a new window

Explore the graph:MB Tule Tower: Open Water 1 (3/19/14-now) in a new window

Explore the graph:MB Tule Tower: Tule Temps 2 & 3 (3/19/14-3/23/17) in a new window

Explore the graph:MB Tule Tower: Tule Temps 2 (3/23/17-now) in a new window

Explore the graph:MB Tule Tower: Tule Temps 3 (3/23/17-now) in a new window

Explore the graph:SRS NDVI Channels in a new window

Explore the graph:SRS NDVI in a new window

Explore the graph:Net Radiation in a new window

Explore the graph:Conductivity in a new window

Can't check MBWPEESWGT_mixed
1 MB_cam graphs found

Explore the graph:Mayberry Autocam GCC in a new window

Can't check MBEEWPSWEPGT_cam
Can't check SIMBTWEE_met
No data found for MB_minidot.
Can't check MBSWEEWPBCBA
1 MB_processed graphs found

Explore the graph:Mayberry processed CO2 Fluxes in a new window

Can't check MB_fd
1 MB_fd graphs found

Explore the graph:Water Forced Diffusion CO2 Flux in a new window