
Field Notes
<--2012-08-22 10:30:00 | 2012-09-06 05:30:00-->Other sites visited today: Vaira
Phenocam link: Searching...
Tonzi: 2012-09-05 05:30:00 (DOY 249)
Author: Siyan Ma
Others: Joe
Summary: Predawn water potential - new tank, standard field work, swapped new CR1000 card at Vaira, removed two SHF plates for cal, co2 profile down for IRGA service.
|
When: Date: 9/5/2012 , Day: 249 , Watch Time: 5:30 am . Where: Tonzi/Vaira Ranch Who: Siyan, Joe Weather: cloudy, a few of rain drops Phenology: golden grassland, oak leaves turned into light brown and dropped.
Summary
Vaira_Grass Site
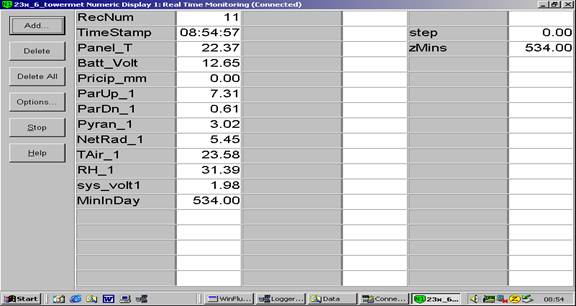
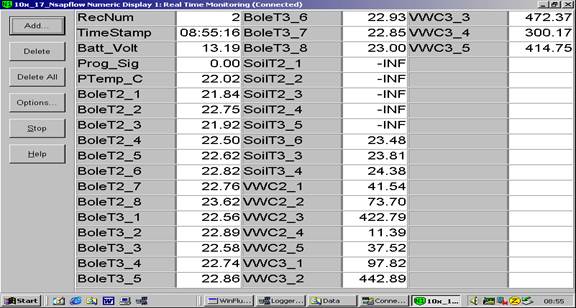
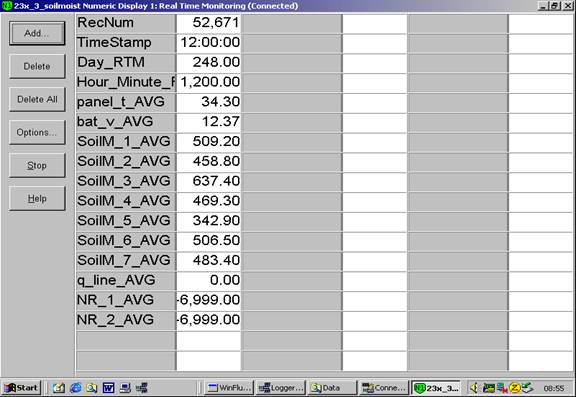
Readings from CR1000 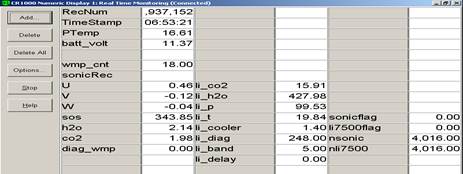
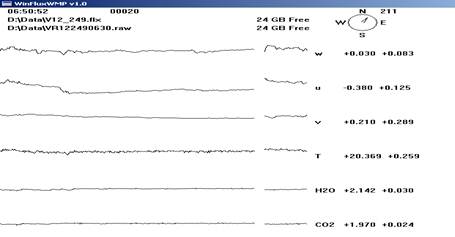
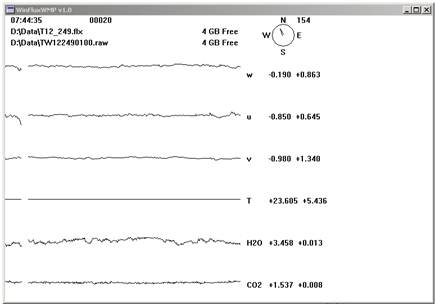
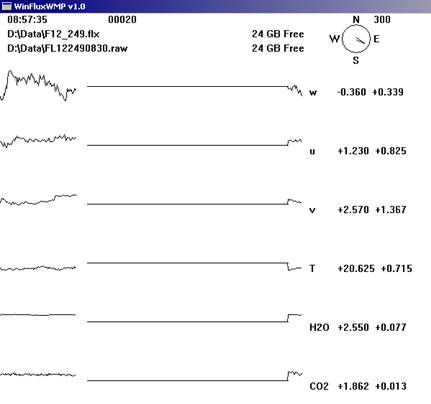
Tonzi_Tower Site
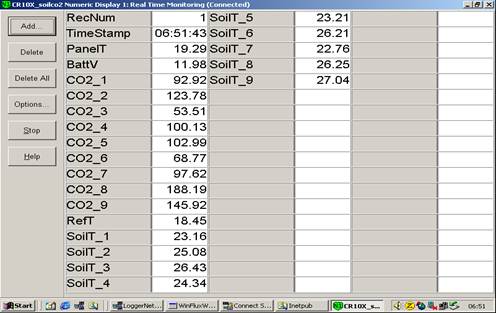
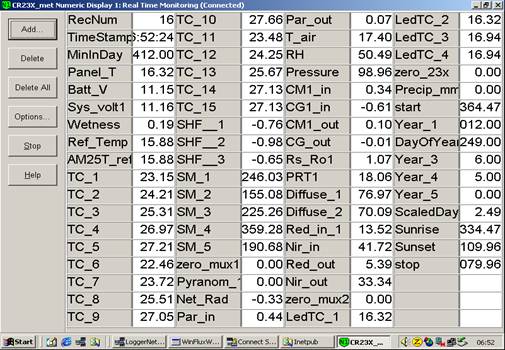
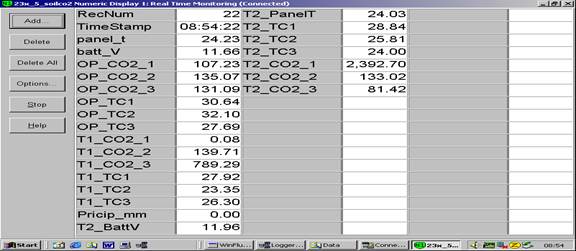
Toniz_Floor Site
CR23X3 – floor-Met CR23X6 – tower-Met CR10X2 – floor-Met CR23X5 – soil CO2 profile 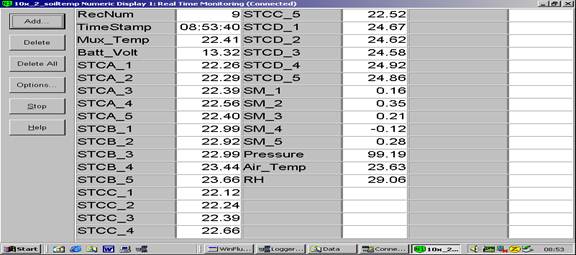
| ||||||||||||||||||||||||||||||||||||||||||||||||||||||||||||||||||||||||||||||||||||||||||||||||||||||||||||||||||||||||||||||||||||||||||||||||||||||||||||||||||||||||||||||||||||||||||||||||||||||||||||||||||||||||||||||||||||||||||||||||||||||||||||||||||||||||||||||||||||||||||
Field Data
No tank data
Well Depth
| Date | Location | Depth (feet) |
|---|---|---|
| 2012-09-05 | TZ_floor | 28.2 |
| 2012-09-05 | TZ_road | 36.8 |
| 2012-09-05 | TZ_tower | 32.7 |
No TZ Moisture Point data found
No VR Moisture Point data found
No TZ grass heigth found
No VR grass heigth found
Tree DBH
| Date | Tag# | Reading (mm) |
|---|---|---|
| 2012-09-05 | 1 | 21.6 |
| 2012-09-05 | 102 | 13.9 |
| 2012-09-05 | 2 | 14.5 |
| 2012-09-05 | 245 | 10 |
| 2012-09-05 | 3 | 18.2 |
| 2012-09-05 | 4 | 3.2 |
| 2012-09-05 | 5 | 24 |
| 2012-09-05 | 7 | 6.8 |
| 2012-09-05 | 72 | 11 |
| 2012-09-05 | 79 | 10.6 |
| 2012-09-05 | 8 | 15.4 |
Water Potential - mode: raw
| Time | Species | Tree | readings (bar) | ||||||||
|---|---|---|---|---|---|---|---|---|---|---|---|
| 2012-09-05 05:05:00 | OAK | UNKNOWN | -58 | -44 | -48 | -17.5 | -25 | -42 | -42 | -53 | -40 |
| 2012-09-05 05:05:00 | PINE | UNKNOWN | -9.5 | -4 | -14.5 | -43 | -23 | -23 | -21 | ||
| 2012-09-05 10:00:00 | OAK | UNKNOWN | -55 | -35 | -47 | -35 | -47 | -36.5 | -22 | -40 | |
| 2012-09-05 10:00:00 | PINE | UNKNOWN | -4 | -17 | -24 | -18 | -21 | -15 | -15 | -13 | |
| 2012-09-05 12:00:00 | OAK | UNKNOWN | -40 | -39 | -39 | -35 | -35 | -40 | -40 | -37 | -35 |
| 2012-09-05 12:00:00 | PINE | UNKNOWN | -20 | -16 | -15 | -20 | -5 | -26 | |||
No TZ Grass Biomass data found
No TZ OakLeaves Biomass data found
No TZ PineNeedles Biomass data found
5 photos found
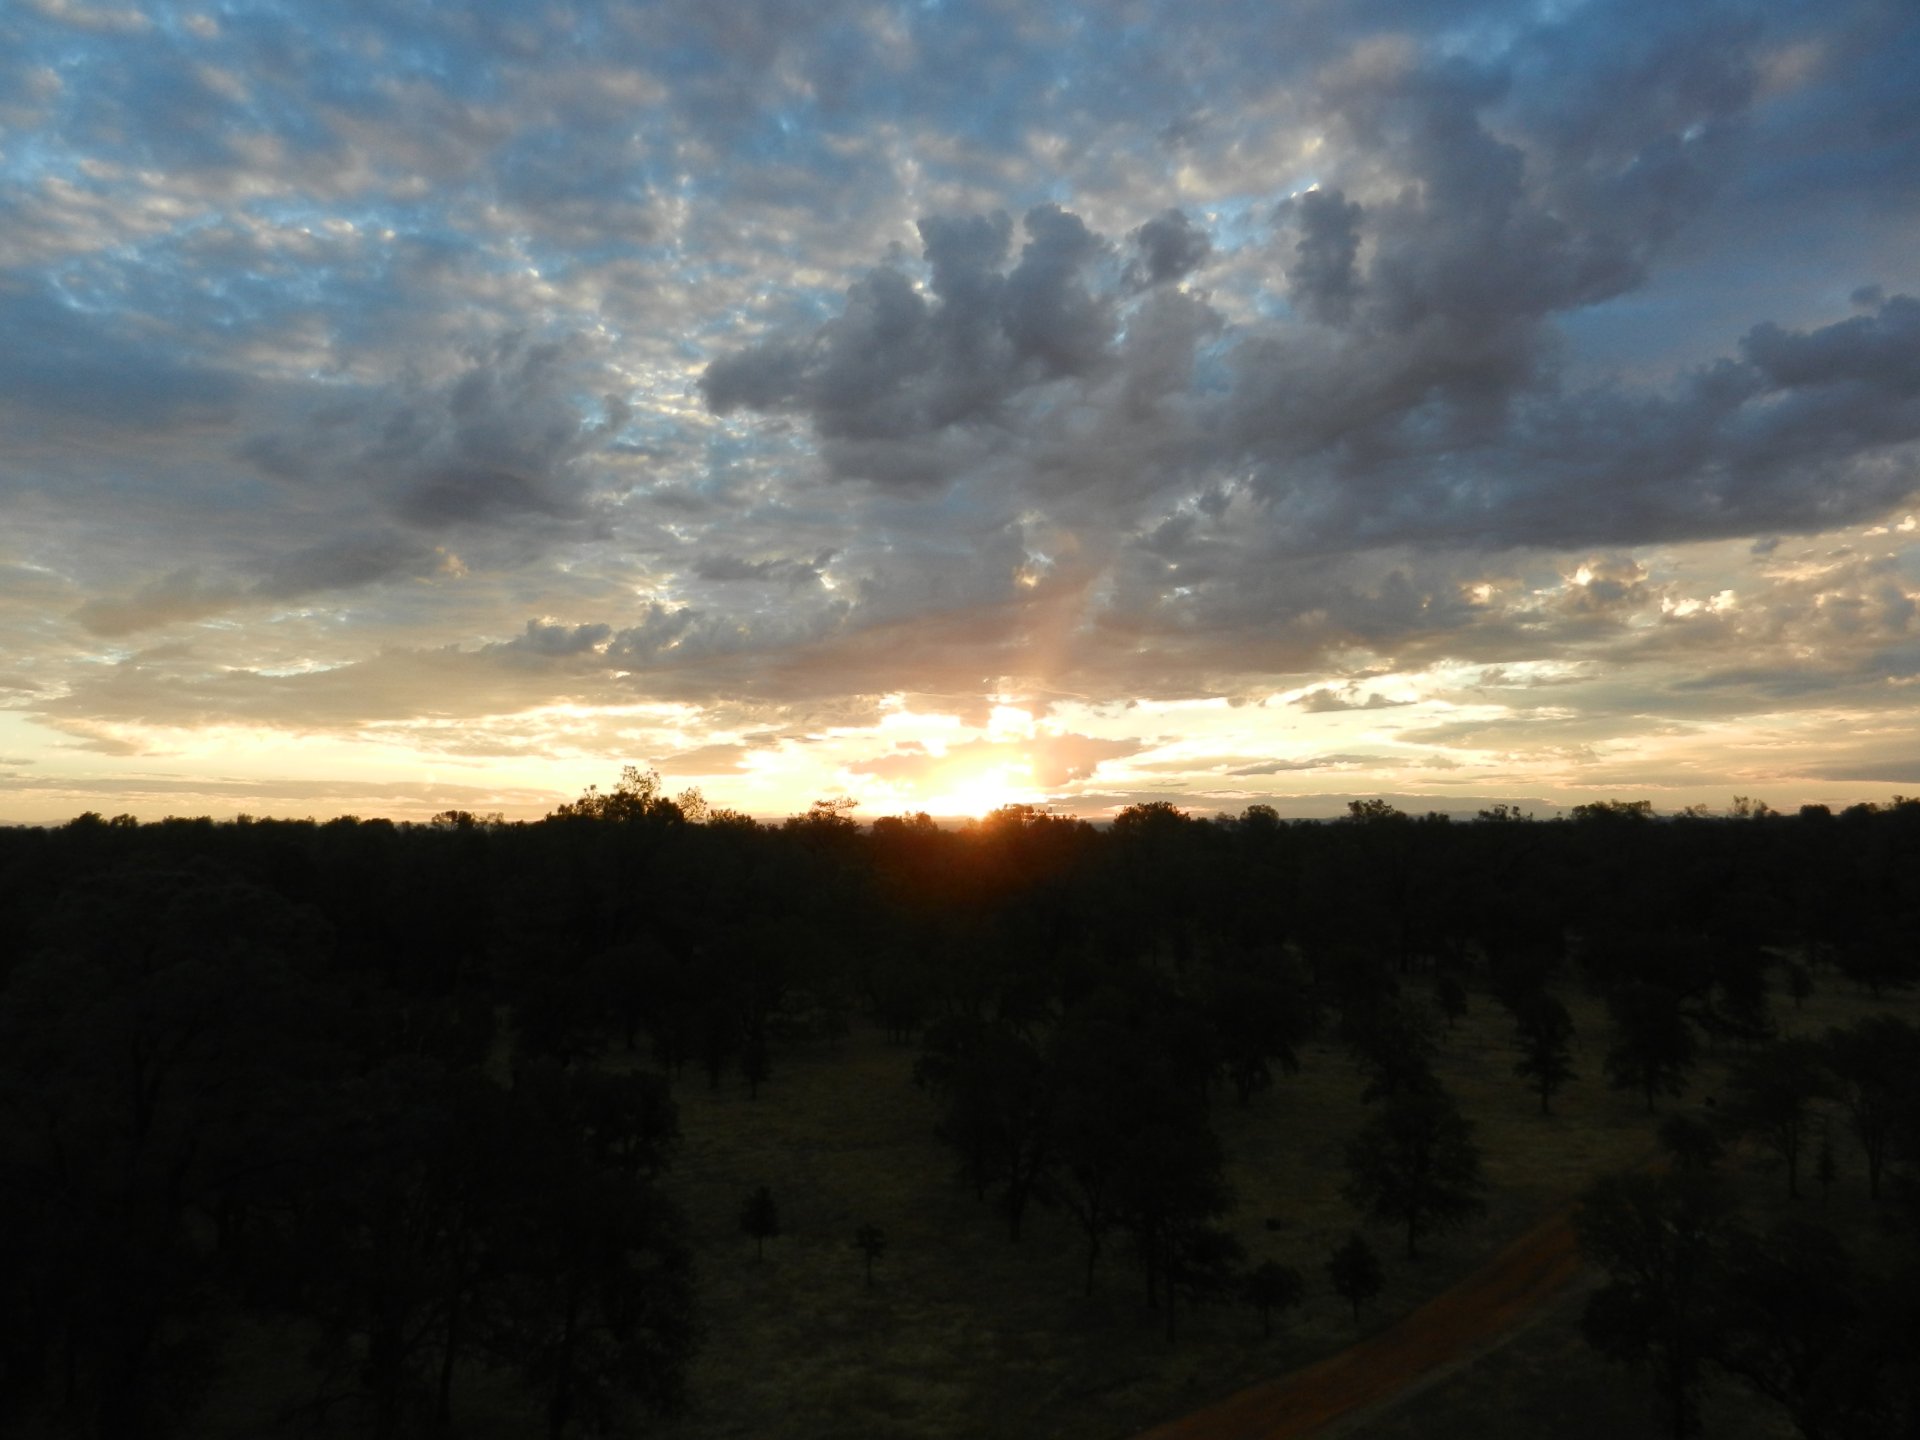
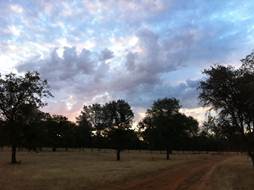
20120905TZ_Dawn.jpg ( 2012-09-05 06:49:44 ) Full size: 1920x1440
Nice sunset over the oak woodland
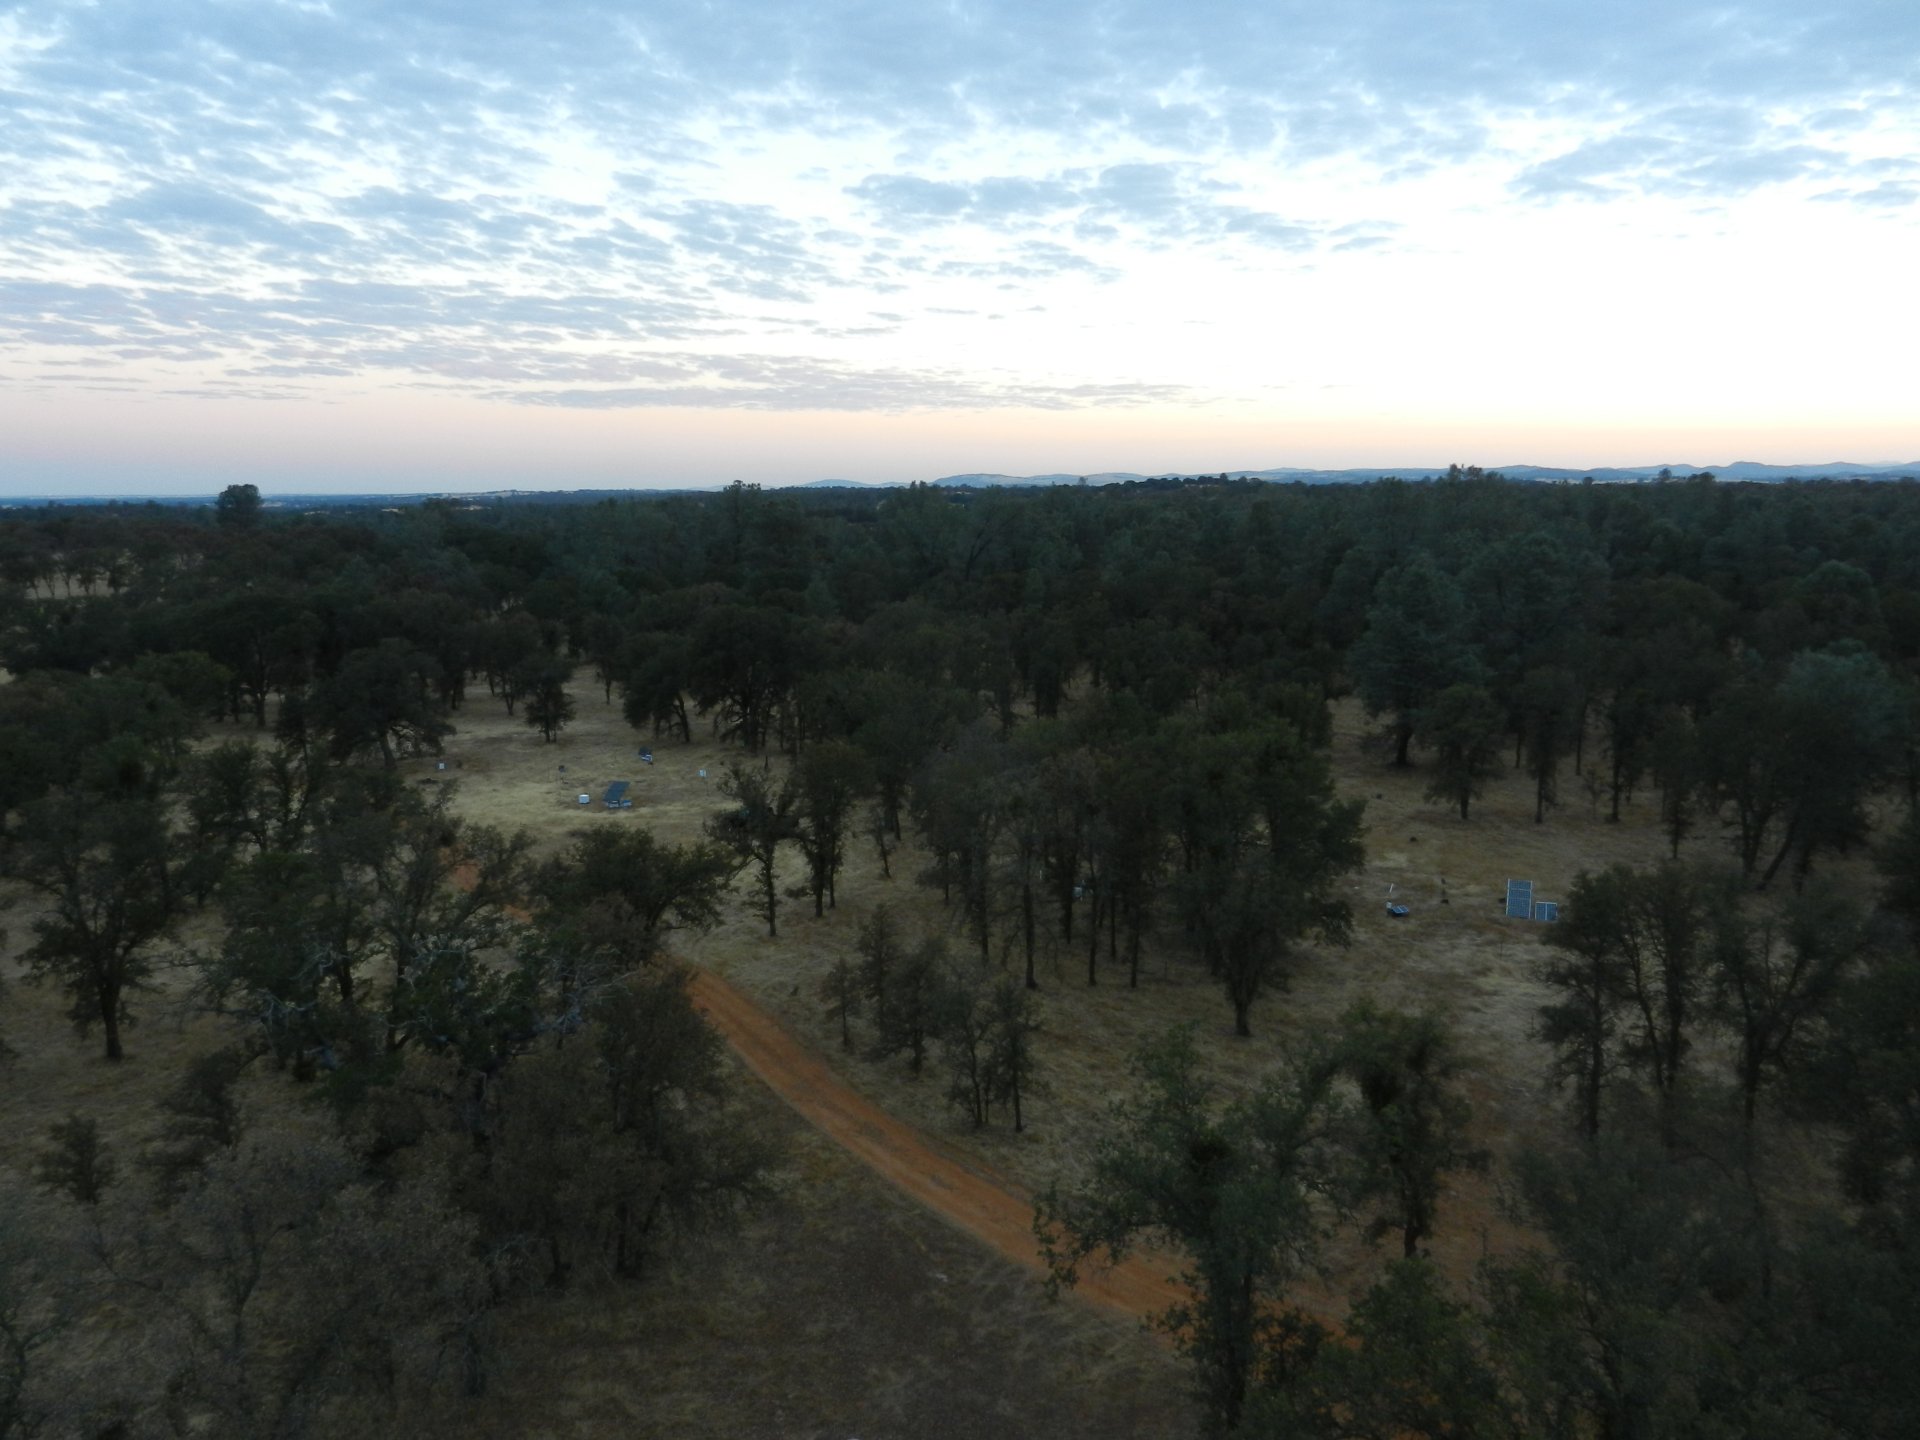
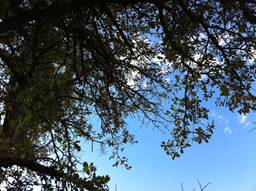
20120905TZ_PredawnSite.jpg ( 2012-09-05 06:37:45 ) Full size: 1920x1440
Predawn view of the oak woodland from the tower top
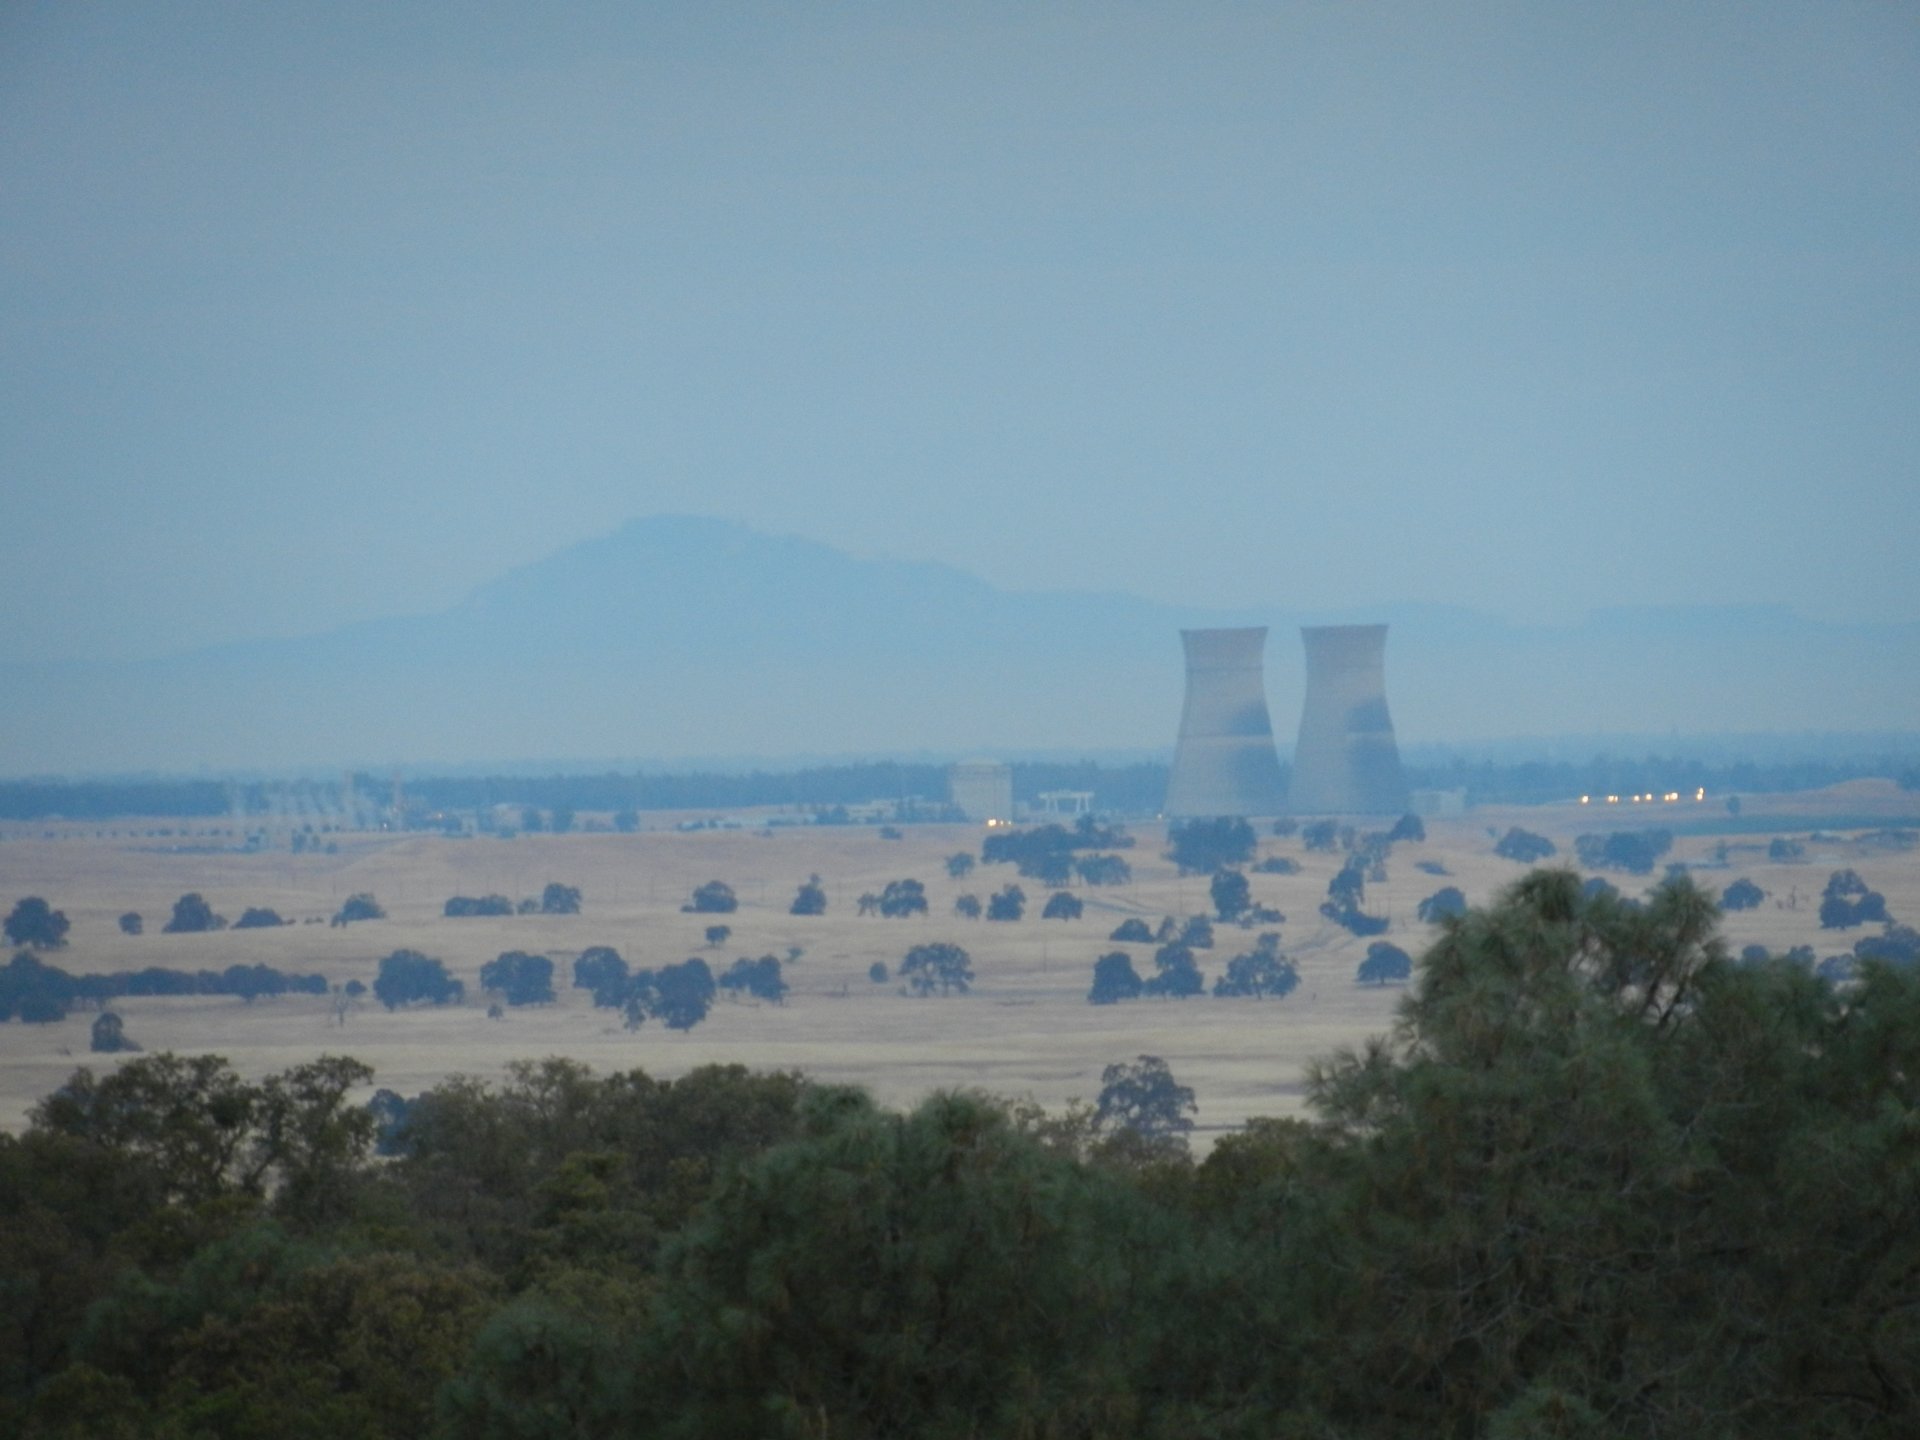
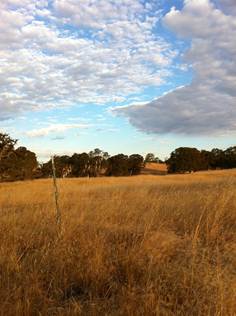
20120905TZ_RanchoSecoDiablo.jpg ( 2012-09-05 06:38:14 ) Full size: 1920x1440
View of Mt Diablo and Rancho Seco from Tonzi Tower
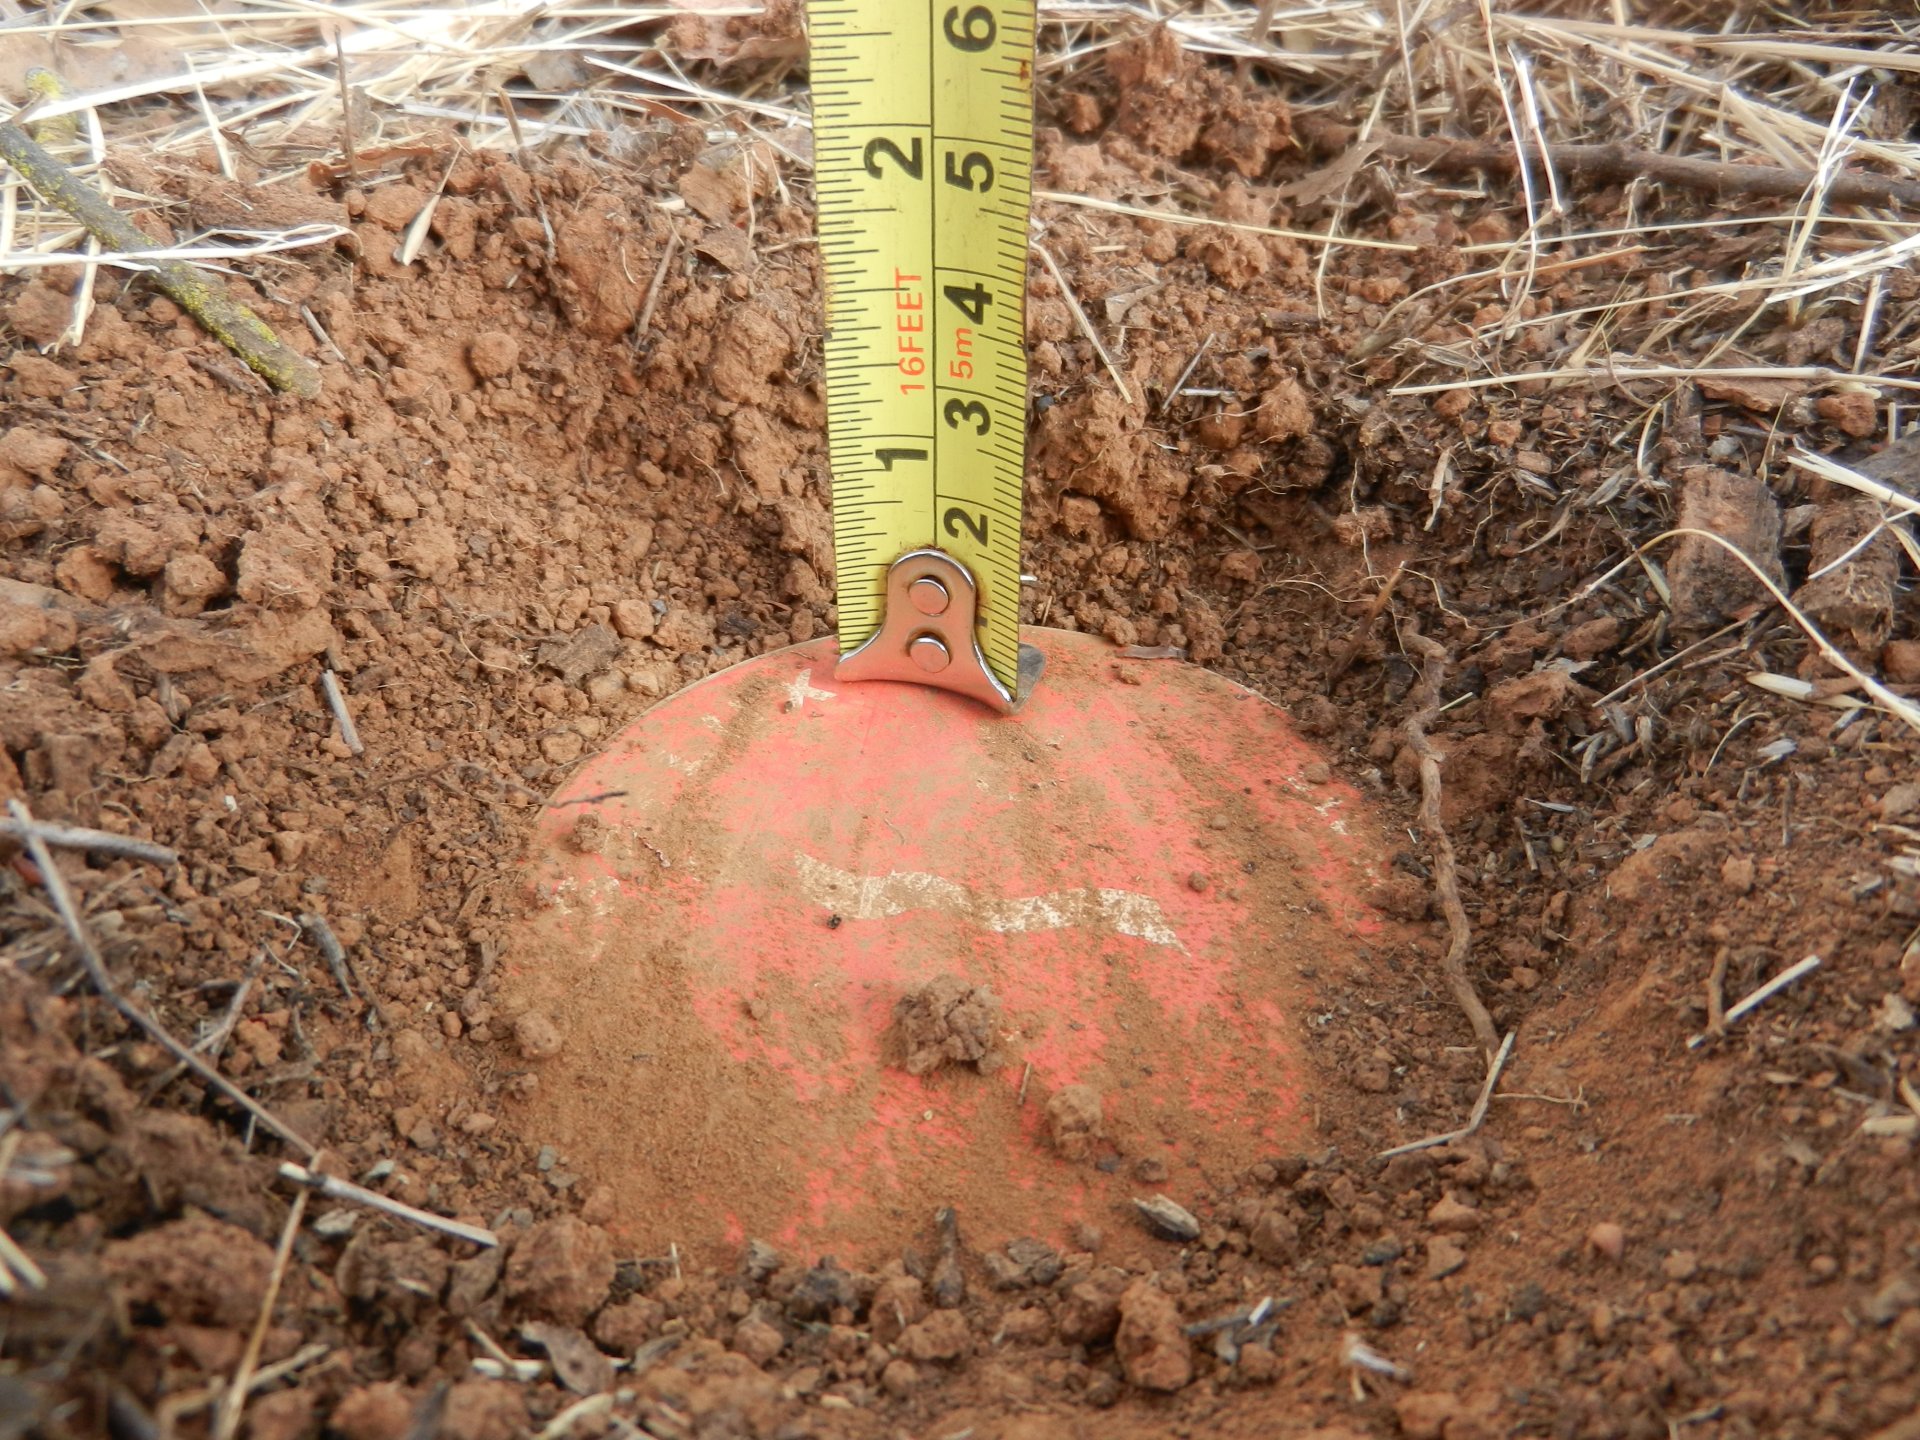
20120905TZ_SHFPlateDepth.jpg ( 2012-09-05 10:04:36 ) Full size: 1920x1440
Depth to recovered soil heat flux plate
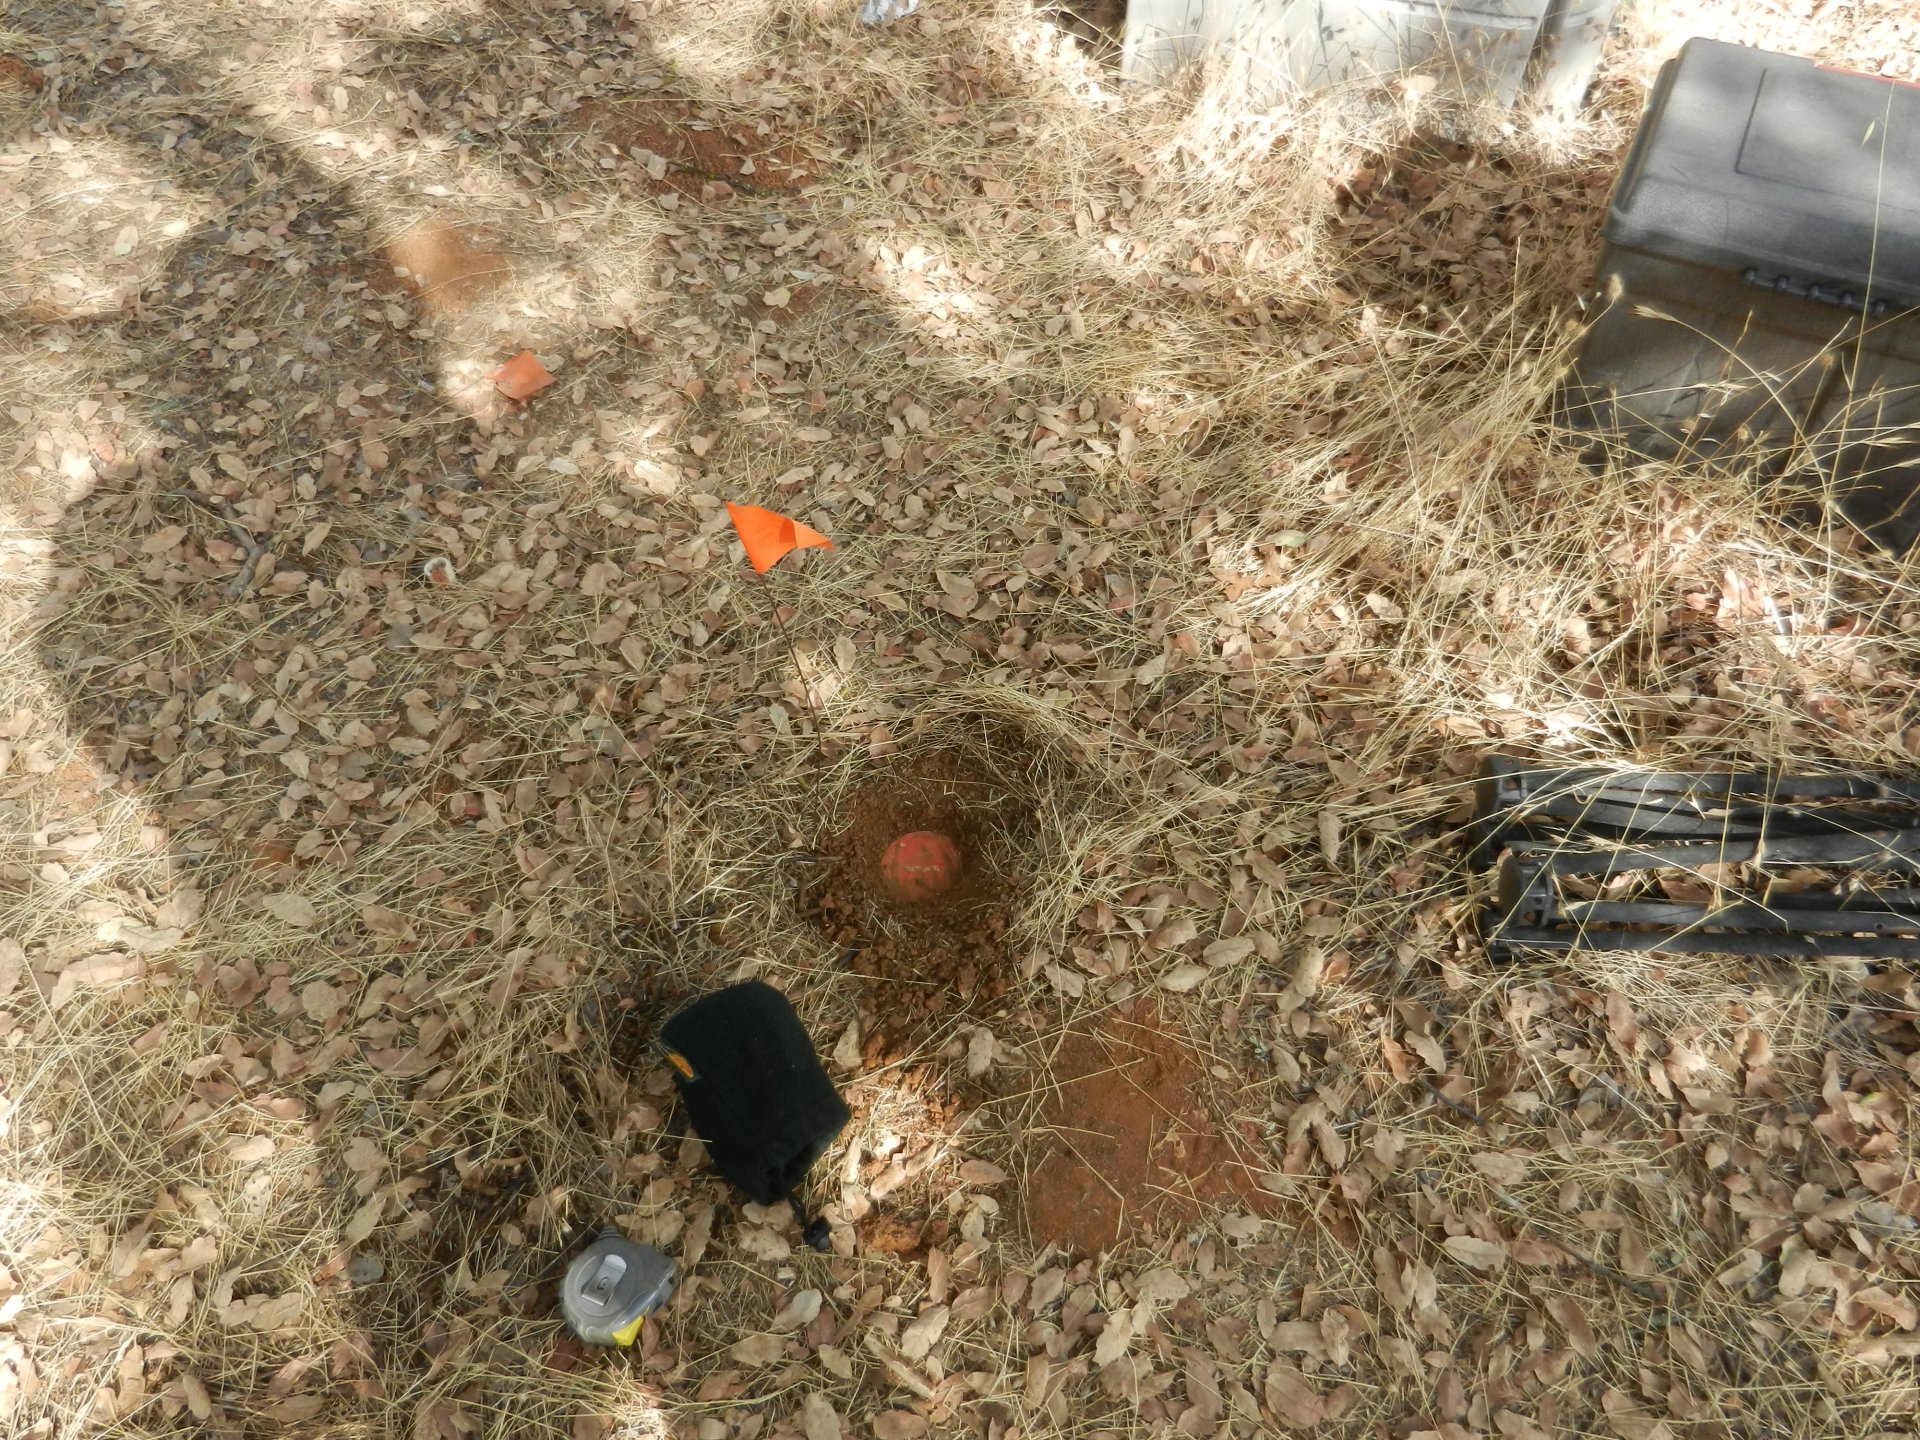
20120905TZ_SHFPlatePosition.jpg ( 2012-09-05 10:05:10 ) Full size: 1920x1440
Location of a soil heat flux plate
16 sets found
No data found for TZ_Fenergy.
11 TZ_tmet graphs found
11 TZ_soilco2 graphs found
Can't check TZ_mixed
3 TZ_mixed graphs found
1 TZ_fflux graphs found
8 TZ_fmet graphs found
1 TZ_tram graphs found
3 TZ_co2prof graphs found
No data found for TZ_irt.
No data found for TZ_windprof.
1 TZ_tflux graphs found
2 TZ_sm graphs found
Can't check TZ_met
1 TZ_met graphs found
Can't check TZVR_mixed
8 TZ_osu graphs found
No data found for TZ_fd.
Tonzi Z-cam data