
Field Notes
<--2012-09-06 05:30:00 | 2012-09-19 05:30:00-->Other sites visited today: Vaira | Tonzi
Phenocam link: Searching...
Tonzi: 2012-09-19 05:15:00 (DOY 263)
Author: Joe Verfaillie
Others: Siyan
Summary: Pre-dawn water potential, reinstall LI-800 and restart co2 profile system, swapped z-cam power supplies.
| Tonzi
2012-09-19 I arrived about 5:15 with Siyan for pre-dawn water potential. It was clear, cool and still with lots of stars in the sky. The day was mild (I wore a jacket until 9am) with a little bit of breeze picking up midday. The tree look not so brown this week, I think a lot of the brown leave have fallen off the trees and the green leaves have remained. We saw Mr Tonzi on the way out. We went to Vaira around 7am and returned about 8am. I reinstalled the Li-800 in the CO2 profile system. The data logger had lost its time. I reset its clock and reloaded the program. It seemed to be running okay and Siyan calibrated it. I removed the filter from the filter holder inside the box hoping this would increase and smooth out the flow. The flow might be a little smoother but did not increase much. There are still filters on each of the inlets. The internal battery of the CR10X that runs the CO2 profile is dead and needs replacing. The batteries on the tower met CR23X (2.5202V) and the Soil CO2 CR23X (2.5587V) are also low. The OS on the Theta Probe CR23X (v0006) and Soil Temperature CR10X (v0009) are really old and could be upgraded. I swapped power supplies on the z-cams. The new power supplies are more efficient and much smaller. I cleaned the window on the WindCube lidar profiler. I collected some old litter pans near the Floor tower for disposal. Looks like the USC folks were here again. They left some tools, but I didn’t notice any new installations. The fans on both computers seem to be failing and need to be replaced. Siyan did water potential, the standard fieldwork and collected data. |
Field Data
No tank data
Well Depth
| Date | Location | Depth (feet) |
|---|---|---|
| 2012-09-19 | TZ_floor | 28.6 |
| 2012-09-19 | TZ_road | 35 |
| 2012-09-19 | TZ_tower | 34 |
No TZ Moisture Point data found
No VR Moisture Point data found
No TZ grass heigth found
No VR grass heigth found
Tree DBH
| Date | Tag# | Reading (mm) |
|---|---|---|
| 2012-09-19 | 1 | 21.6 |
| 2012-09-19 | 102 | 13.9 |
| 2012-09-19 | 2 | 14.5 |
| 2012-09-19 | 245 | 10.1 |
| 2012-09-19 | 3 | 18.1 |
| 2012-09-19 | 4 | 3.1 |
| 2012-09-19 | 5 | 24 |
| 2012-09-19 | 7 | 19.1 |
| 2012-09-19 | 72 | 10.8 |
| 2012-09-19 | 79 | 10.3 |
| 2012-09-19 | 8 | 6.9 |
Water Potential - mode: raw
| Time | Species | Tree | readings (bar) | ||||||||
|---|---|---|---|---|---|---|---|---|---|---|---|
| 2012-09-19 05:20:00 | OAK | UNKNOWN | -49 | -51.5 | -44 | -53 | -55 | -55 | -27.5 | -28 | -26.5 |
| 2012-09-19 05:20:00 | PINE | UNKNOWN | -25 | -15 | -20 | -25 | -25 | -13 | |||
| 2012-09-19 10:14:00 | OAK | UNKNOWN | -55.5 | -42 | -48 | -38 | -40 | -49 | -37 | -37 | |
| 2012-09-19 10:14:00 | PINE | UNKNOWN | -17 | -12 | -15 | -22 | -21 | ||||
No TZ Grass Biomass data found
No TZ OakLeaves Biomass data found
No TZ PineNeedles Biomass data found
1 photos found
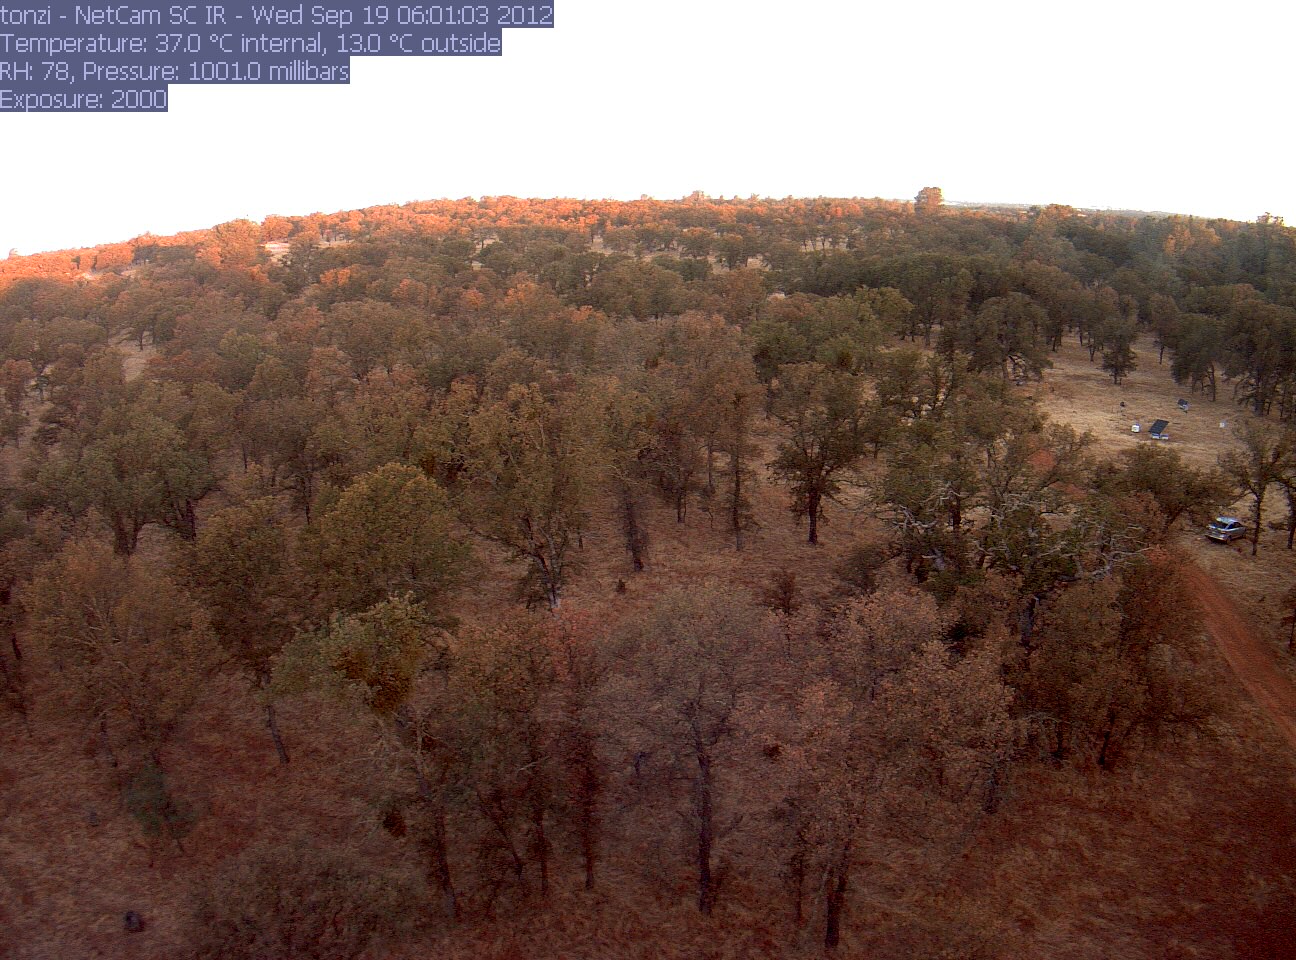
tonzi_2012_09_19_060103.jpg ( 2012-09-19 05:58:02 ) Full size: 1296x960
Predawn water potential
16 sets found
No data found for TZ_Fenergy.
11 TZ_tmet graphs found
11 TZ_soilco2 graphs found
Can't check TZ_mixed
3 TZ_mixed graphs found
1 TZ_fflux graphs found
8 TZ_fmet graphs found
1 TZ_tram graphs found
3 TZ_co2prof graphs found
No data found for TZ_irt.
No data found for TZ_windprof.
1 TZ_tflux graphs found
2 TZ_sm graphs found
Can't check TZ_met
1 TZ_met graphs found
Can't check TZVR_mixed
8 TZ_osu graphs found
No data found for TZ_fd.
Tonzi Z-cam data