Field Notes
<--2012-06-06 05:40:00 |
2012-07-10 10:00:00-->
Phenocam link:
Searching...Tonzi: 2012-07-04 05:20:00 (DOY 186)
Author: Siyan Ma
Others:
Summary: Swapped tank and measured water potential, standard field work.
When: Date: 7/4/2012 , Day: 186
, Watch Time: 5:20am
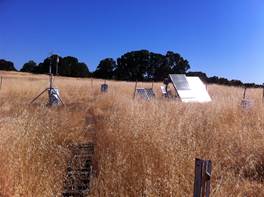
Where: Tonzi/Vaira Ranch
Who: Siyan
Weather: clear, sunny
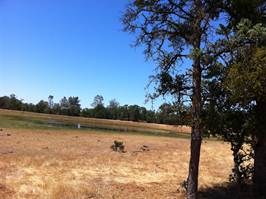
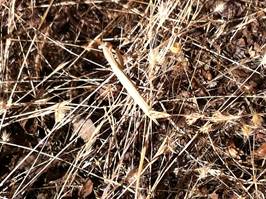
Phenology: dead grasses looked bright yellow under the
sun; green oak leaves, likely less leaves; the third layers of single pine
shoots showed yellow needles.
Summary
- Swapped the tank and measured water potential of oak
leaves and pine needles at watch time 5:30, 8:30, 13:00, and 14:00. The
lowest water potential occurred at 8:30, which is interesting to me.
- Checked and downloaded data at Tower, Floor, and Vaira
successfully
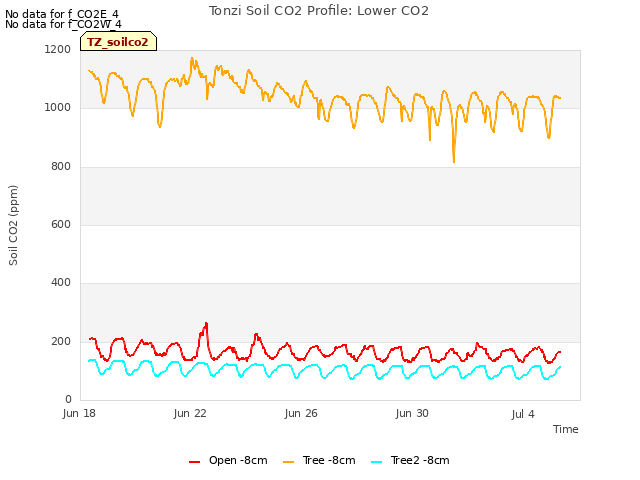
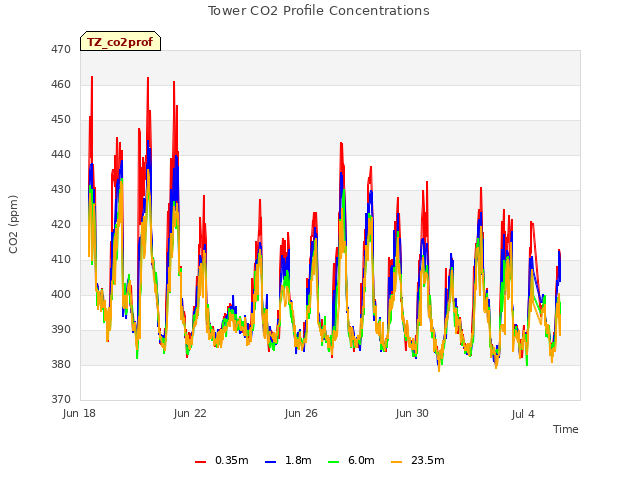
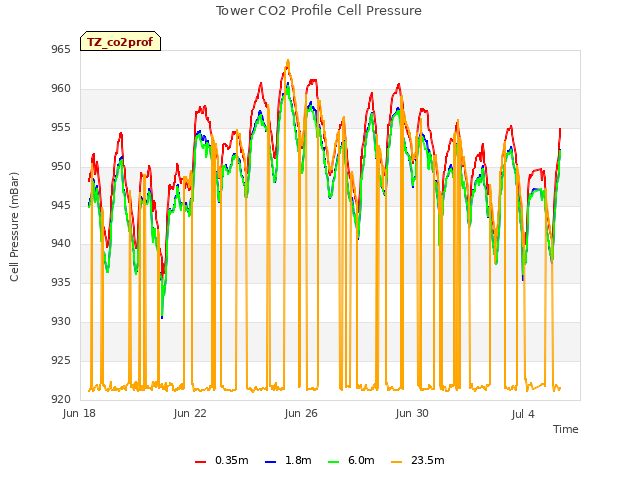
- Calibrated Li-800 in the field. The CO2 profile system
worked well.
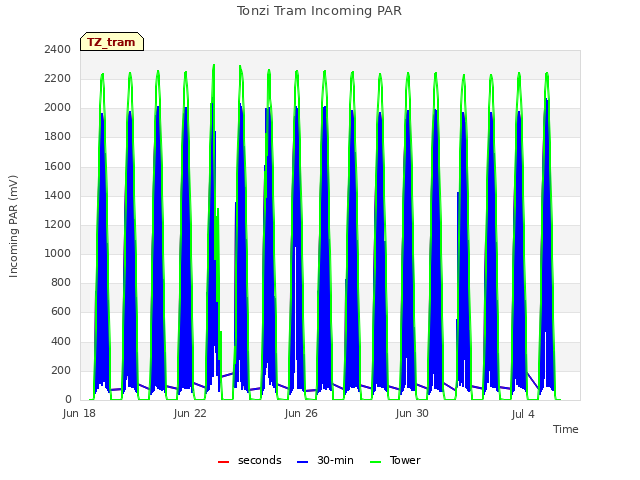
- Tram system was working.
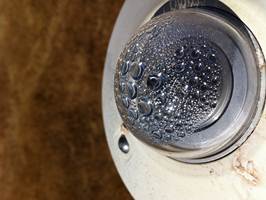
- Pyronometer at Vaira had water inside the cover (see
the photo above)
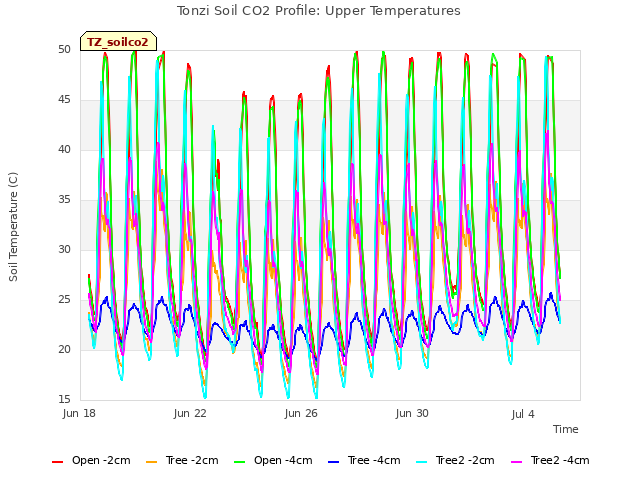
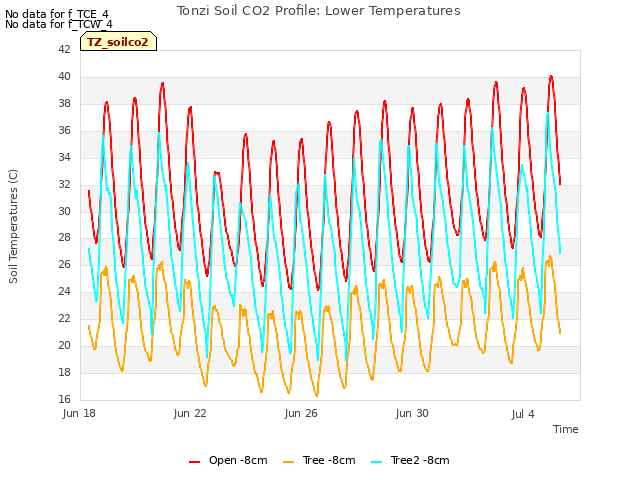
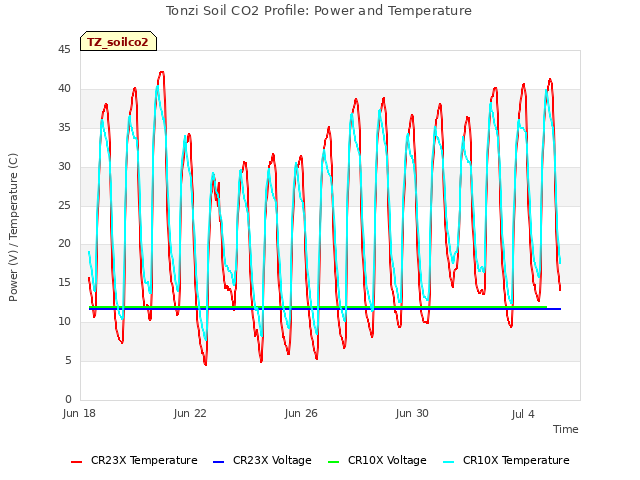
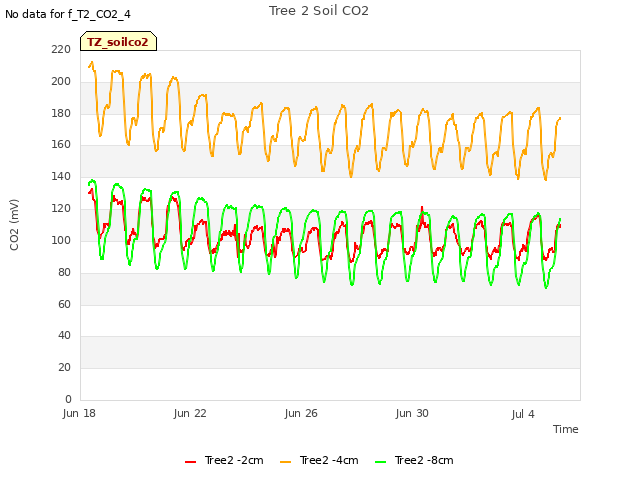
- Checked soil CO2 profile systems at both sites.
- Read dendrometers
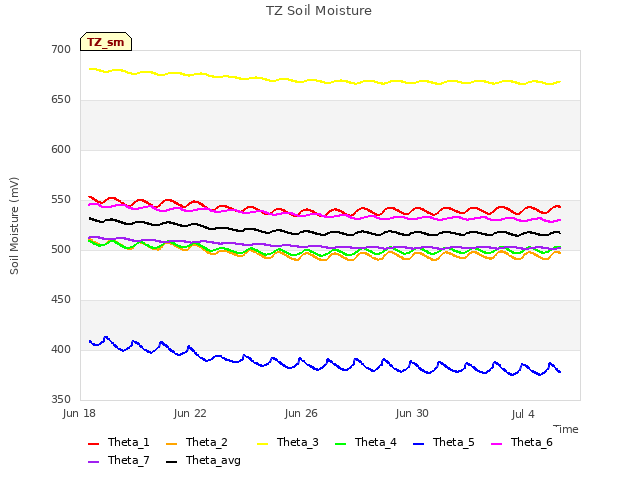
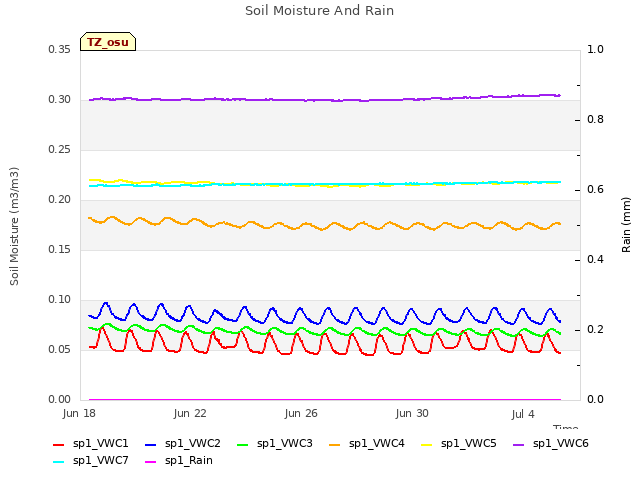
- Measured soil moisture
- Measured groundwater well:
Date
|
DOY
|
Location
|
Depth without the black thing (feet)
|
7/4/2012
|
186
|
Floor
|
24.4
|
|
|
Tower
|
29.1
|
|
|
roadside
|
34.2
|
Vaira_Grass Site
- Fence and gate power: 12 v.
- Panel and Batteries: - v;
- amps; - amps.
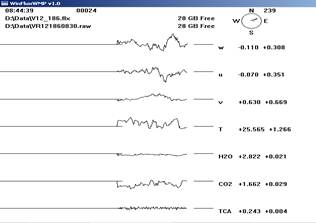
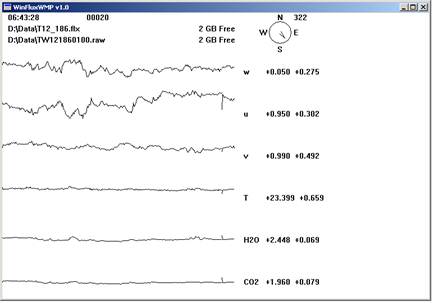
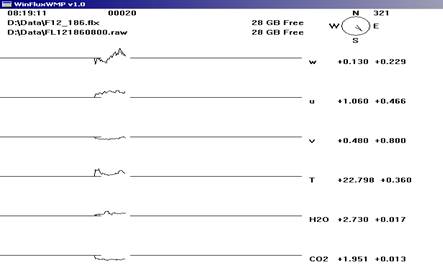
- Reading from Gillsonic screen before downloading data.
(The value of H2O and CO2 should be in the range of
0 – 5 v.)
- downloading data YES!
- Check the fans of air temp. and relative humidity sensors
at Vaira. YES!
- Check MD-9 system connections YES!
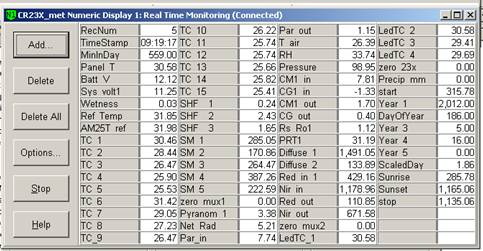
- Check CR23X with two multiplexers
- Download data from soil CO2 profiles: first I had
trouble to talk to the CR10X datalogger with the cables I brought from the
lab; then I tried talking to it with the cables that Joe installed in the
computer enclosure, and changed the COM Port to #5, and then it worked for
me.
- Check levels of Radiation sensors, clear up surfaces. YES!
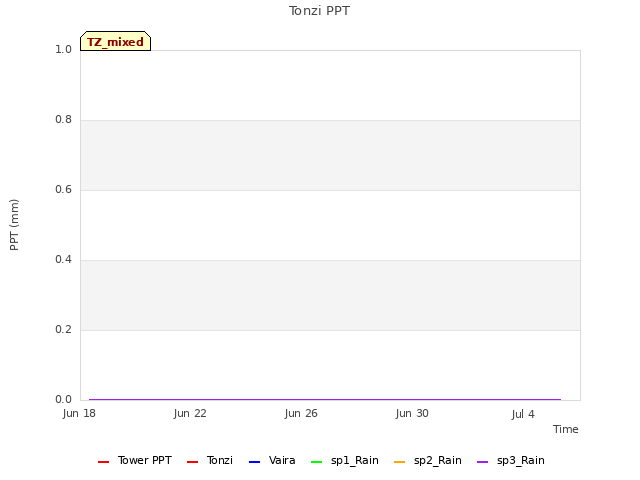
- Check rain gage, make sure not clogged. YES!
- Closed gate and set up fence. YES!
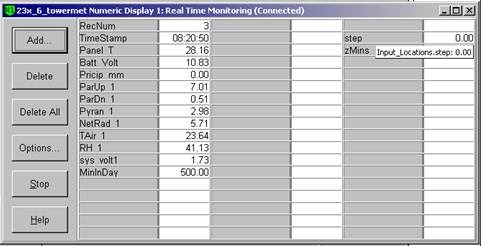
Tonzi_Tower Site
- Fence and gate power: 12 v.
- Panel and Batteries: 12.5
v; 0.7 amps;
2.8 amps. (I read these values
around 7:00am and tried downloading data, but the computer restarted
itself.)
- Reading from Gillsonic screen before downloading data.
(The value of H2O and CO2 should be in the range of
0 – 5 v.)
- downloading data YES!
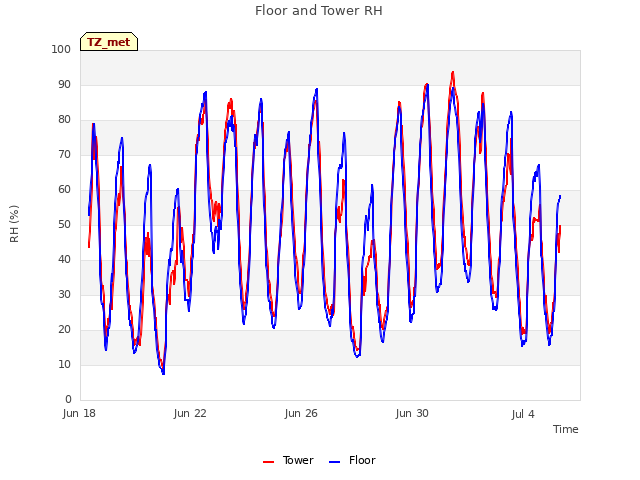
- check the fans of air temp. and relative humidity sensors
on the tower and the floor. YES!
- Check rain gage, make sure not clogged. YES!
- Check calibration cylinders;
CO2 1100 psig; flow 20 psi; 421.63
ppm.
N2 1500 psig; flow 20 psi.
Is the pump running YES!
- Check levels of Radiation sensors, clear up surfaces. YES!
- Clean up upfacing camera surfaces. YES!
- close gate and set up fence. YES!
Toniz_Floor Site
- Fence and gate power: 12
v.
- Panel and Batteries: - v;
- amps; - amps. (about 7:00 am local time)
- Reading from Gillsonic screen before downloading data.
(The value of H2O and CO2 should be in the range of
0 – 5 v.)
- downloading data YES!
- Check MD-9 system connections YES!
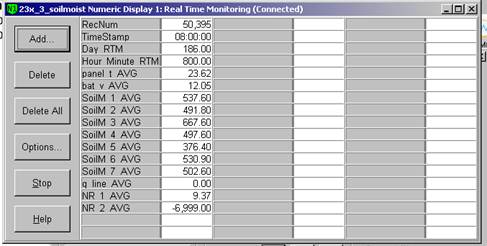
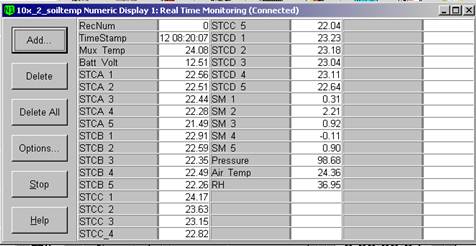
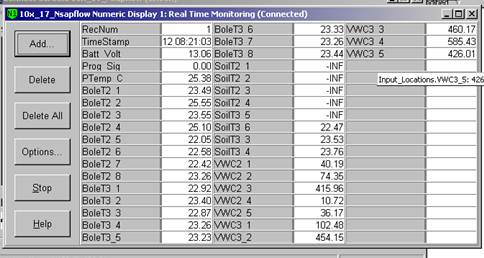
- Soil CO2 profile: CR23X5 – soil CO2
profile
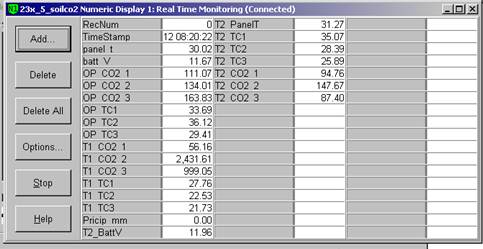
- Close gate and set up fence. YES!
tonzi
|
7931AFE
|
402165
|
574B4B
|
402FF3
|
574632
|
7A432E
|
7A3C6E
|
7A3B40
|
7A4AAA
|
7/4/2012
|
186
|
|
|
|
|
|
|
|
|
|
sm
|
|
|
|
|
|
|
|
|
0-15
|
7.3
|
2.7
|
#DIV/0!
|
5.5
|
11.1
|
1.6
|
7.9
|
#DIV/0!
|
5.5
|
15-30
|
13.6
|
10.0
|
16.4
|
16.0
|
10.9
|
10.0
|
15.5
|
15.7
|
6.0
|
30-45
|
20.1
|
13.0
|
13.6
|
19.8
|
14.4
|
10.6
|
15.9
|
16.5
|
13.1
|
45-60
|
#DIV/0!
|
3.0
|
25.0
|
20.7
|
11.1
|
12.4
|
18.9
|
25.4
|
11.6
|
|
|
|
|
|
|
|
|
|
|
|
A6D882B
|
A3D04E8
|
A6D72F5
|
|
|
|
|
|
|
|
|
|
|
|
|
|
|
|
|
0-15
|
3.9
|
2.5
|
2.4
|
|
|
|
|
|
|
15-30
|
7.8
|
2.7
|
13.9
|
|
|
|
|
|
|
30-45
|
16.7
|
16.7
|
16.9
|
|
|
|
|
|
|
45-60
|
19.9
|
24.4
|
16.6
|
|
|
|
|
|
|
|
|
|
|
|
|
|
|
|
|
vaira
|
57318a
|
7933dee
|
00000128B97F3
|
00000128B8072
|
00000128BDDE8
|
|
|
|
0-15
|
broken
|
2.6
|
1.8
|
1.9
|
#DIV/0!
|
|
|
|
|
15-30
|
broken
|
10.3
|
6.55
|
7.2
|
#DIV/0!
|
|
|
|
|
30-45
|
broken
|
12.5
|
2.4
|
11.7
|
#DIV/0!
|
|
|
|
|
45-60
|
broken
|
25.4
|
14.5
|
8.9
|
16.2
|
|
|
|
|
Tonzi
|
|
|
|
|
|
Dendrometer
|
|
|
|
|
|
|
|
|
|
|
Date
|
Day
|
Tag
#
|
Reading (mm)
|
|
|
7/4/2012
|
186
|
72
|
12.2
|
|
|
|
|
79
|
11.8
|
|
|
|
|
102
|
14.0
|
|
|
|
|
245
|
11.0
|
|
|
|
|
250
|
X
|
(reset to 10.5 on May 7, 2009)
|
|
|
|
1
|
-
|
|
|
|
|
2
|
15.8
|
|
|
|
|
3
|
19.2
|
|
|
|
|
4
|
3.5
|
|
|
|
|
5
|
23.9
|
|
|
|
|
7
|
16.36
|
133
|
|
|
|
8
|
7.4
|
11828
|
|
|
|
71
|
X
|
|
|
|
|
77
|
X
|
|
|
|
|
78
|
X
|
|
|
|
|
248
|
X
|
broken
|
|
|
|
255
|
X
|
|
|
|
|
252
|
X
|
|
|
|
|
6
|
X
|
|
|
Notes: “X” means not working any more.
Dendrometers installed by Gretchen group |
Field Data
No tank data
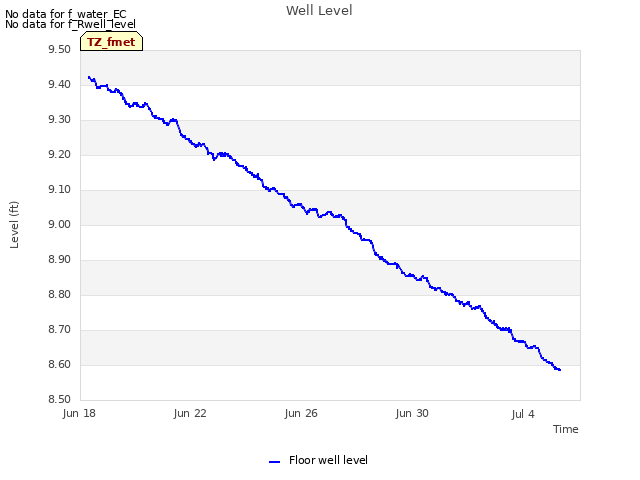
Well Depth
| Date | Location | Depth (feet) |
|---|
| 2012-07-04 | TZ_floor | 24.4 |
| 2012-07-04 | TZ_road | 34.2 |
| 2012-07-04 | TZ_tower | 29.1 |
No TZ Moisture Point data found
No VR Moisture Point data found
No TZ grass heigth found
No VR grass heigth found
Tree DBH
| Date | Tag# | Reading (mm) |
|---|
| 2012-07-04 | 102 | 14 |
| 2012-07-04 | 2 | 15.8 |
| 2012-07-04 | 245 | 11 |
| 2012-07-04 | 3 | 19.2 |
| 2012-07-04 | 4 | 3.5 |
| 2012-07-04 | 5 | 23.9 |
| 2012-07-04 | 7 | 16.36 |
| 2012-07-04 | 72 | 12.2 |
| 2012-07-04 | 79 | 11.8 |
| 2012-07-04 | 8 | 7.4 |
Water Potential - mode: raw
| Time | Species | Tree | readings (bar) |
|---|
| 2012-07-04 04:16:00 |
OAK |
UNKNOWN |
-18 |
-13.5 |
-11.5 |
-15 |
-14.5 |
-14.5 |
-12.5 |
-10.5 |
-4 |
-5 |
-8 |
| 2012-07-04 04:16:00 |
PINE |
UNKNOWN |
-2 |
-0.5 |
-3 |
-0.5 |
-1.5 |
-1 |
-3 |
-5 |
-2 |
-3.5 |
-1.5 |
| 2012-07-04 07:48:00 |
OAK |
UNKNOWN |
-28.5 |
-26.5 |
-24.5 |
-30 |
|
|
|
|
|
|
|
| 2012-07-04 07:48:00 |
PINE |
UNKNOWN |
-6.5 |
-1.5 |
-8.5 |
-2.5 |
|
|
|
|
|
|
|
| 2012-07-04 12:00:00 |
OAK |
UNKNOWN |
-27.5 |
-9 |
-21 |
-19 |
-13 |
-25 |
-27 |
|
|
|
|
| 2012-07-04 12:00:00 |
PINE |
UNKNOWN |
-2 |
-2.5 |
-2.5 |
-8.5 |
-3 |
-2 |
|
|
|
|
|
| 2012-07-04 13:00:00 |
OAK |
UNKNOWN |
-20 |
-23 |
-18.5 |
-23.5 |
|
|
|
|
|
|
|
No TZ Grass Biomass data found
No TZ OakLeaves Biomass data found
No TZ PineNeedles Biomass data found
0 photos found
16 sets found
No data found for TZ_Fenergy.
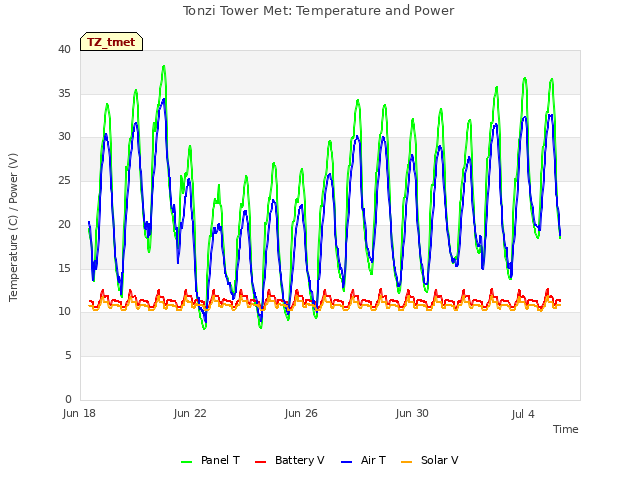
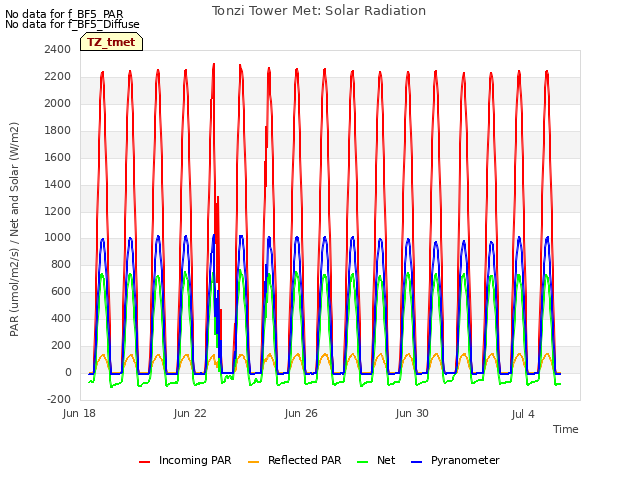
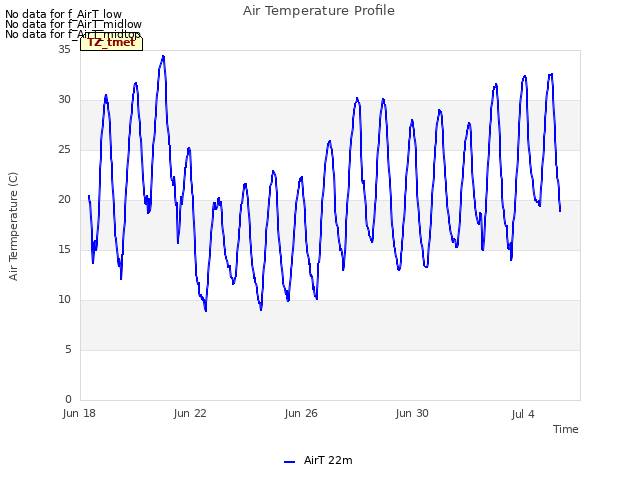
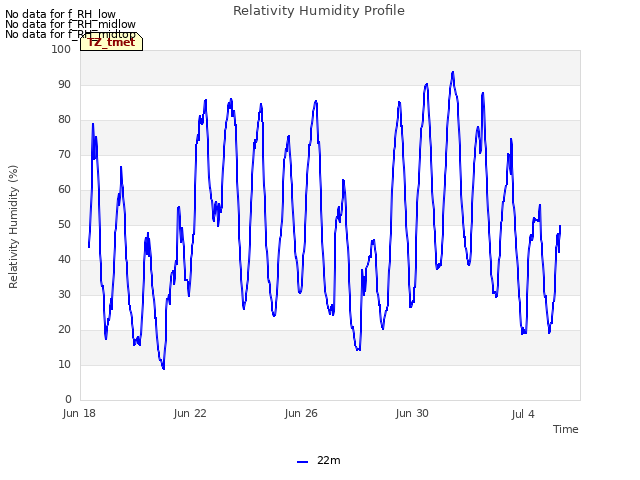
11 TZ_tmet graphs found


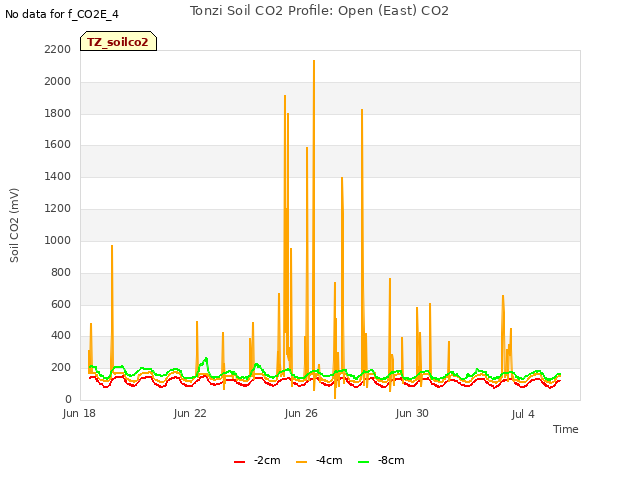
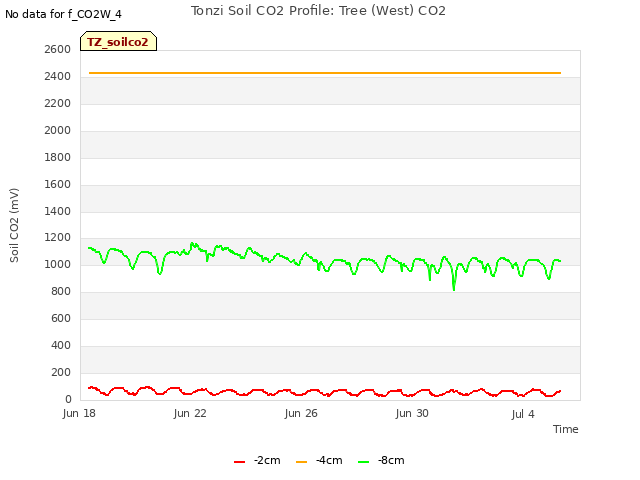
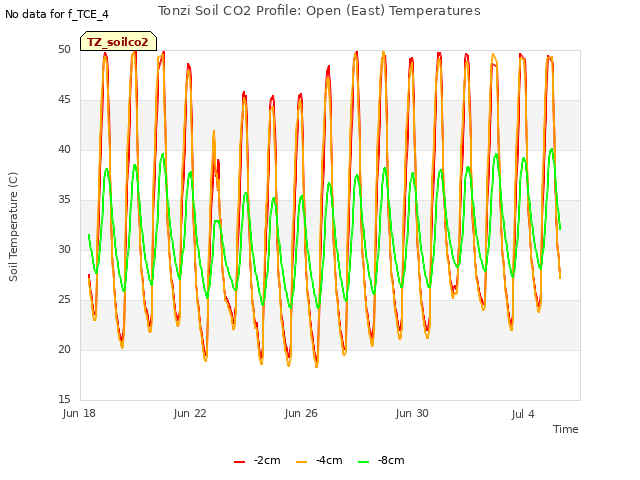
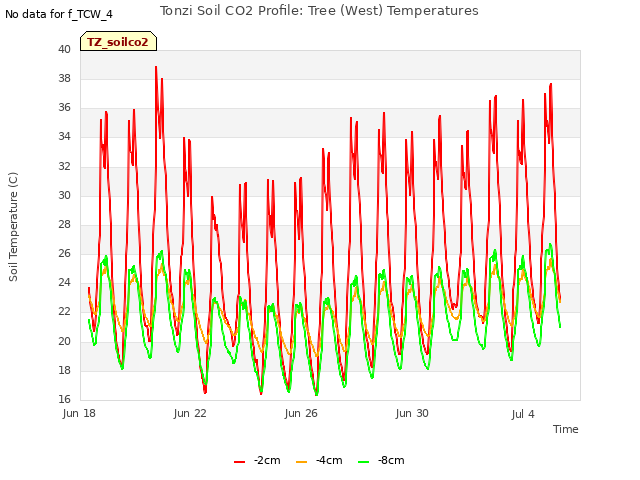
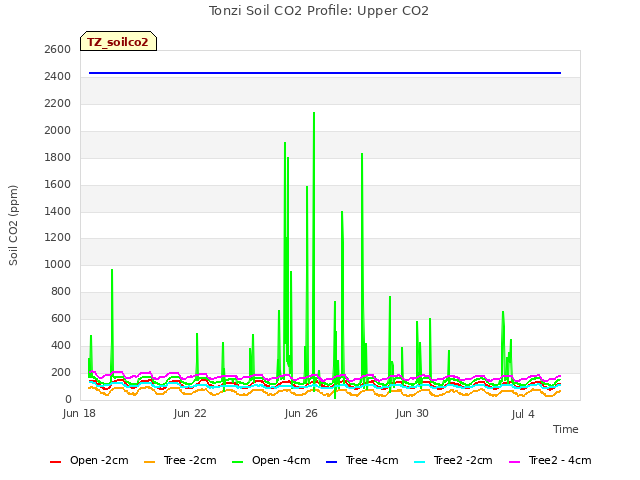
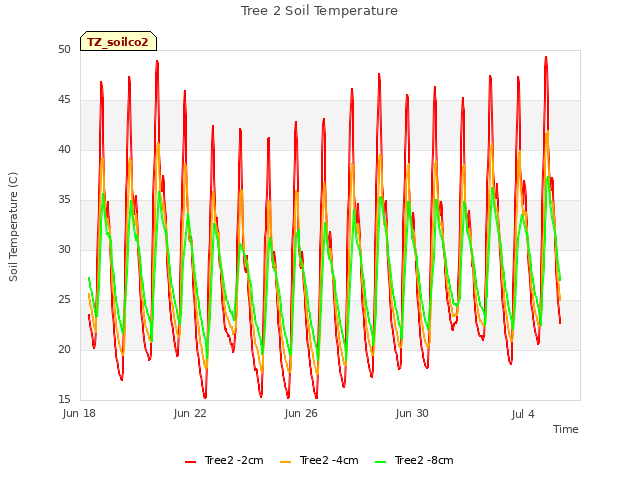
11 TZ_soilco2 graphs found
Can't check TZ_mixed
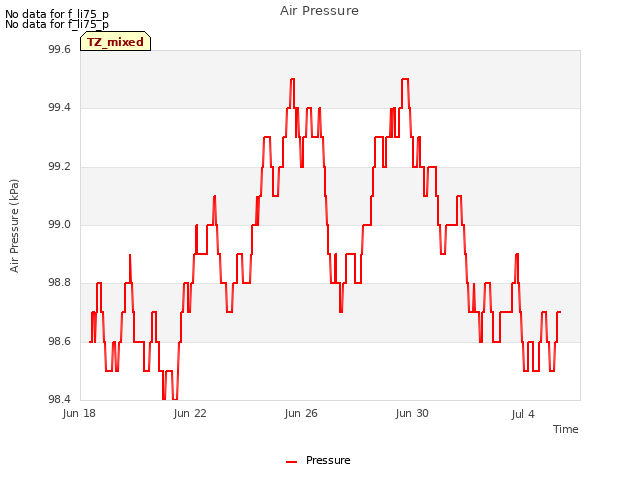
3 TZ_mixed graphs found

1 TZ_fflux graphs found

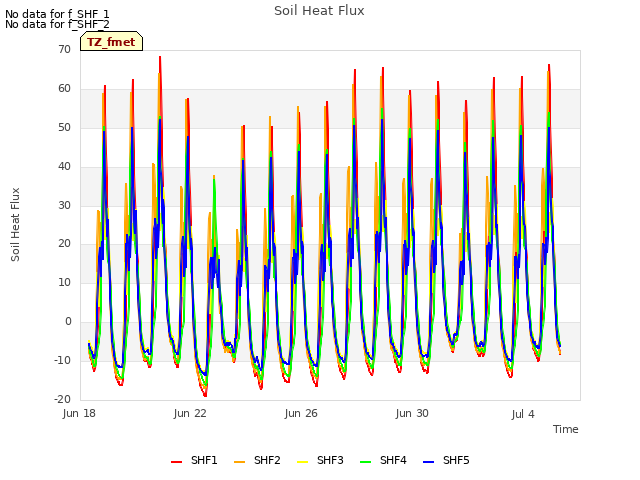
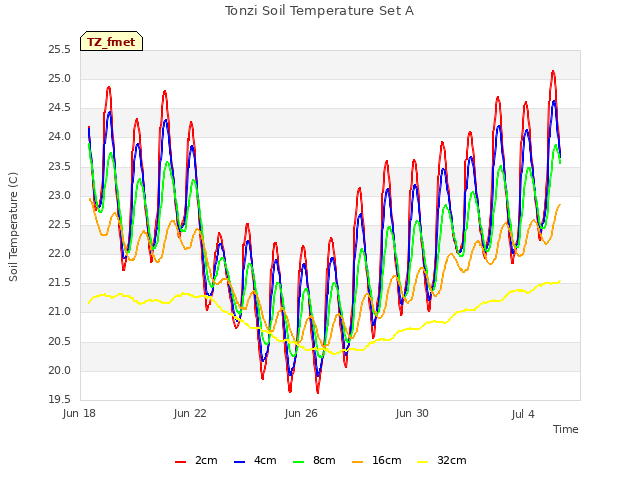
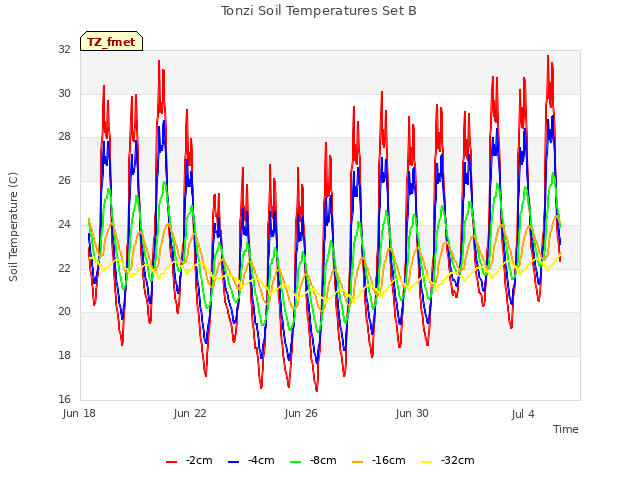
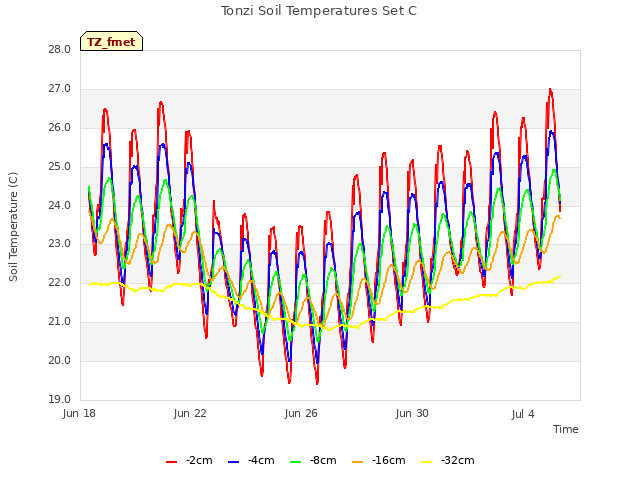
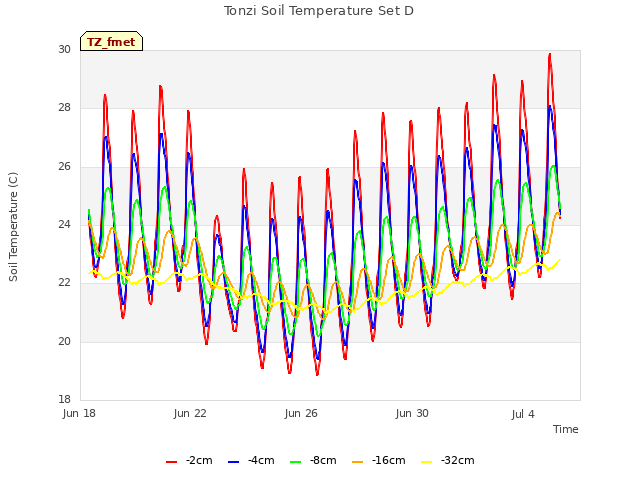
8 TZ_fmet graphs found


1 TZ_tram graphs found
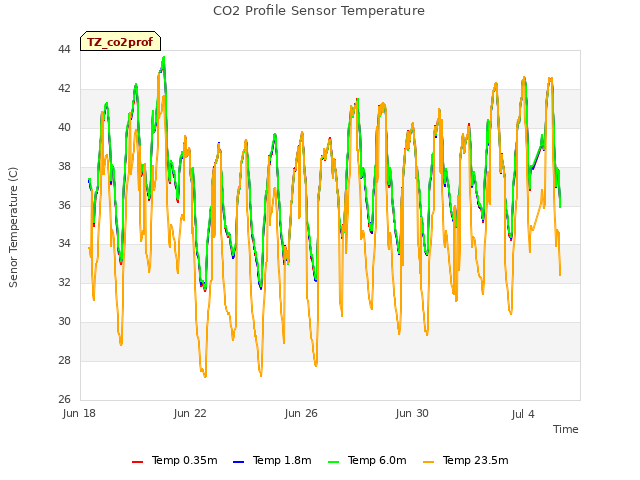
3 TZ_co2prof graphs found
No data found for TZ_irt.
No data found for TZ_windprof.
1 TZ_tflux graphs found

2 TZ_sm graphs found

Can't check TZ_met
1 TZ_met graphs found
Can't check TZVR_mixed
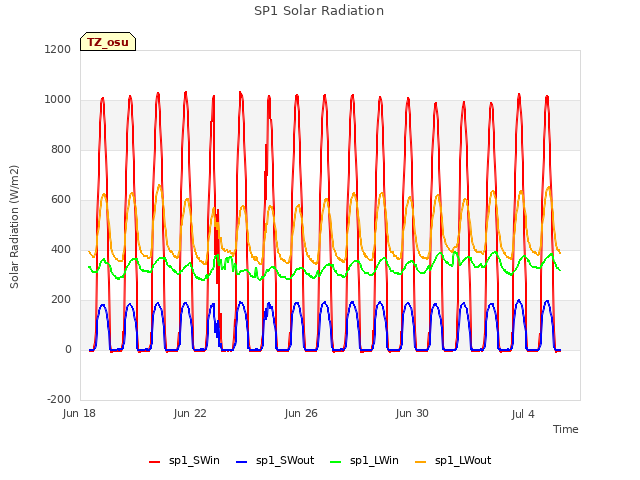
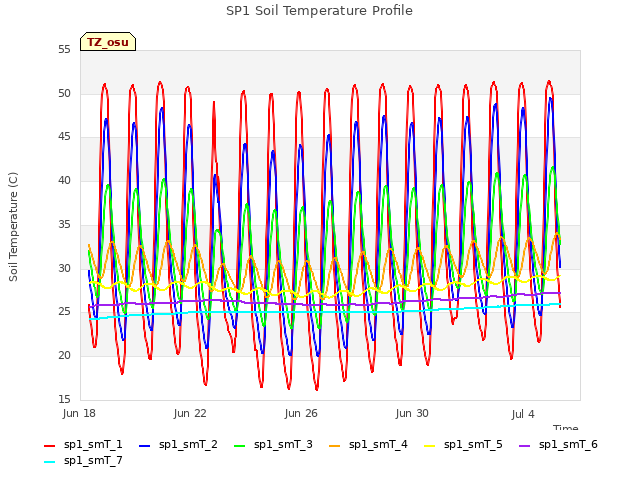
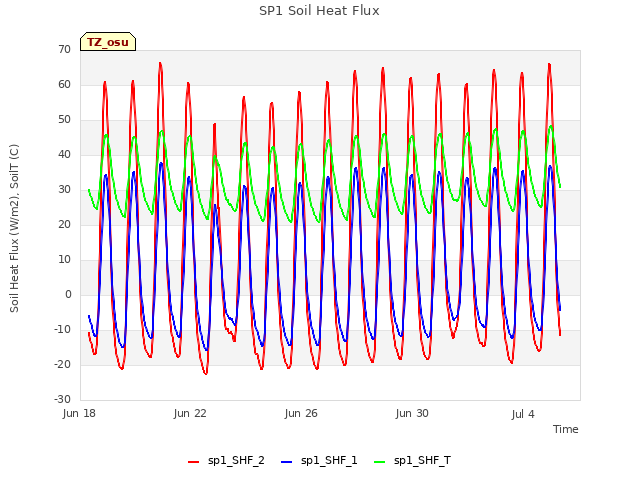
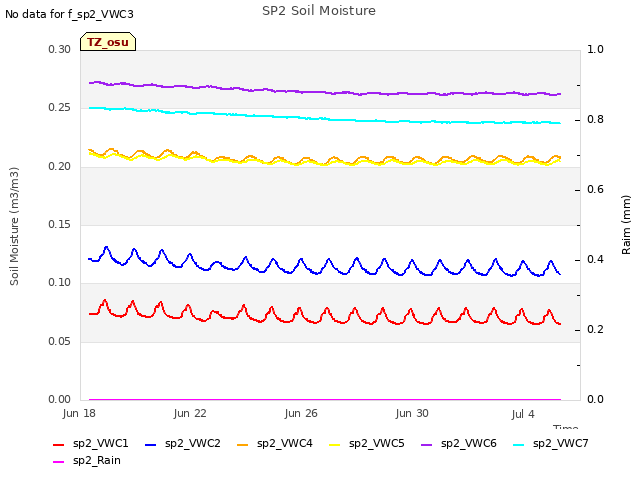
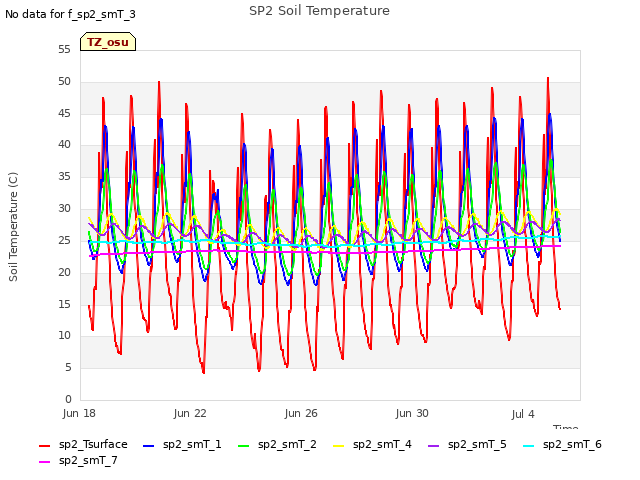
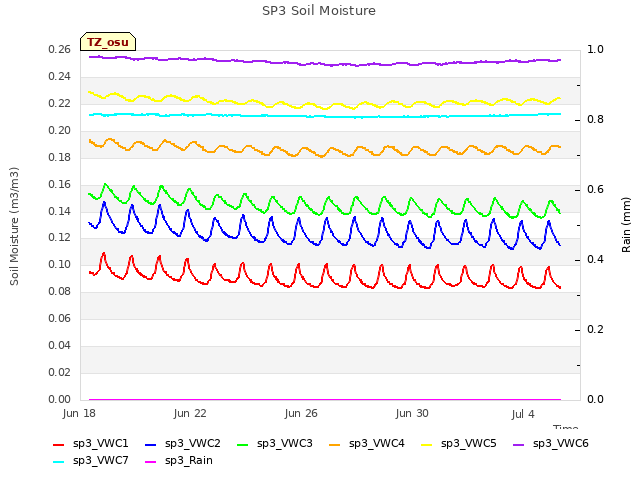
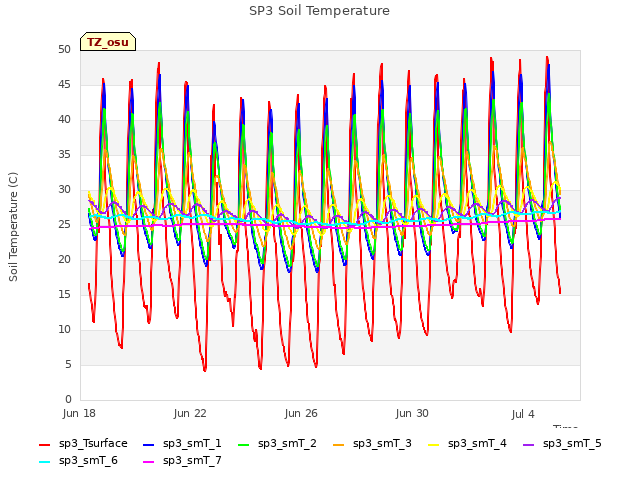
8 TZ_osu graphs found
No data found for TZ_fd.
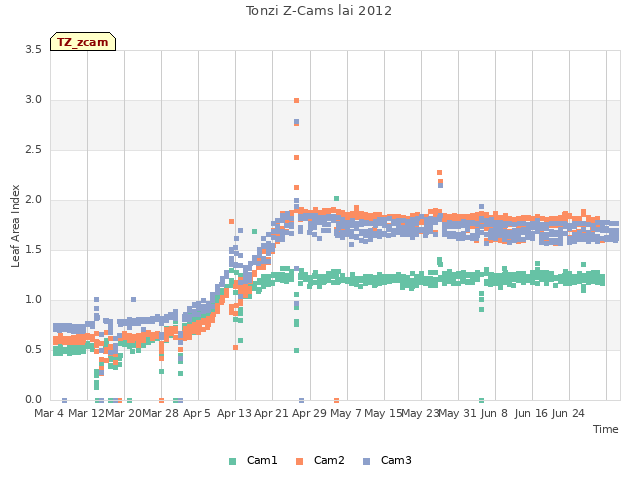
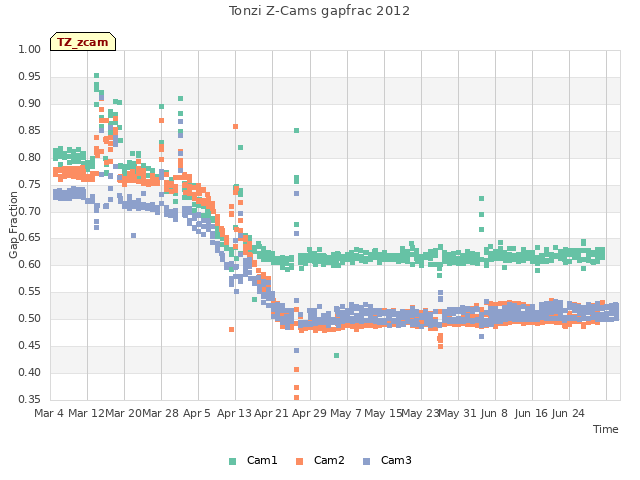
Tonzi Z-cam data