
Field Notes
<--2009-07-10 11:00:00 | 2009-09-07 05:00:00-->Phenocam link: Searching...
Tonzi: 2009-08-02 05:00:00 (DOY 214)
Author: Siyan Ma
Others:
|
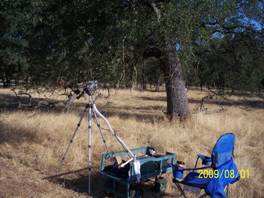
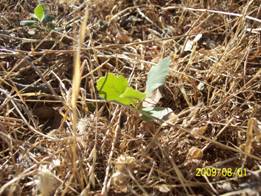
When: Date: 8/2/2009 , Day: 214 , Watch Time: 5:00 . Where: Tonzi/Vaira Ranch Who: Siyan Weather: hot, nice breeze Phenology: yellow grass, green oak leaves
Summary
Vaira_Grass Site
Tonzi_Tower Site
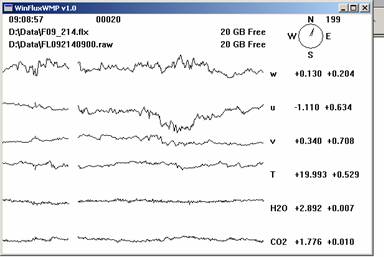
CO2 500 psig; flow 20 psi; 431.25 ppm. N2 500 psig; flow 20 psi. Manually calibrate Li-800. Following Ted’s instruction: H:\IoneSavanna_2004\Tower_2004\CO2Profile\LI800_Calibration_Procedure_2Nov04.txt Is the pump running‌ No. Pump was dead. I took it back to lab. 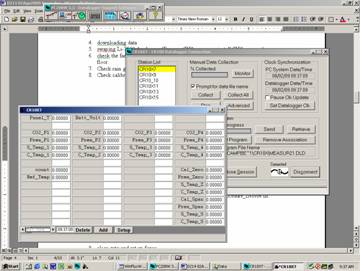
Toniz_Floor Site
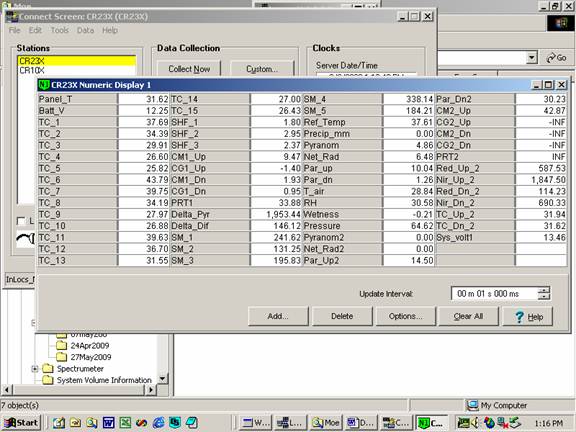
CR23X3 – floor-Met 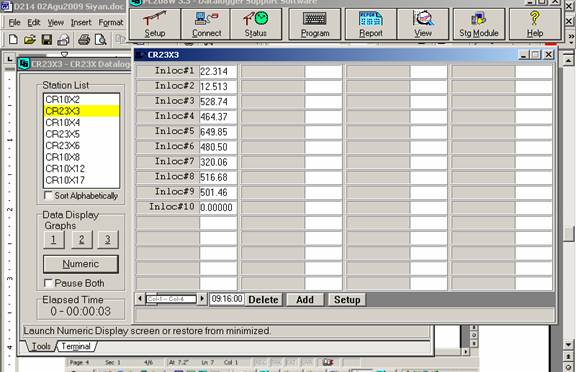 CR23X5 – soil CO2 profile CR23X6 – tower-Met 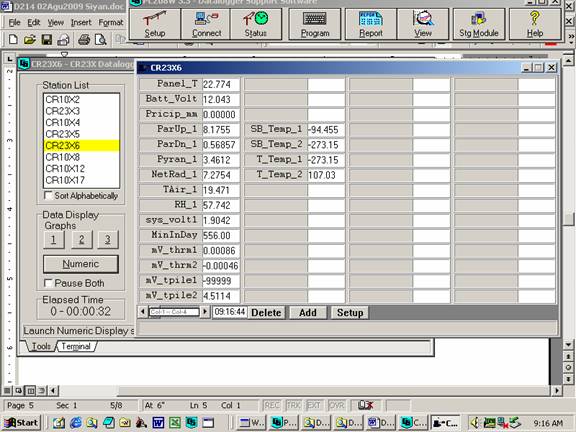 CR10X2 – floor-Met 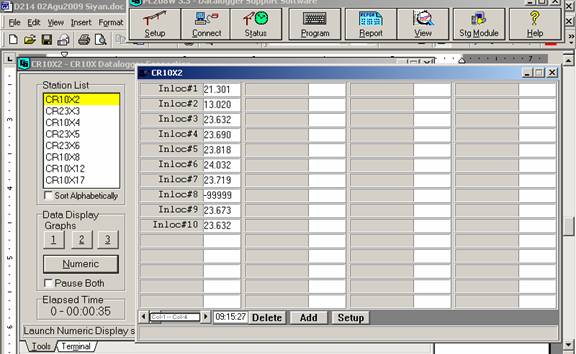
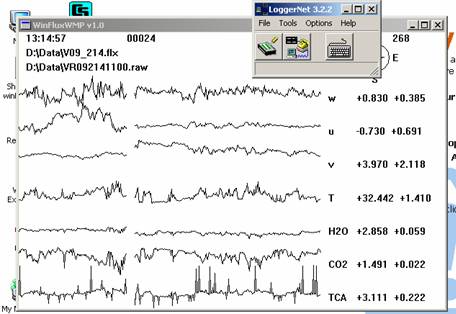
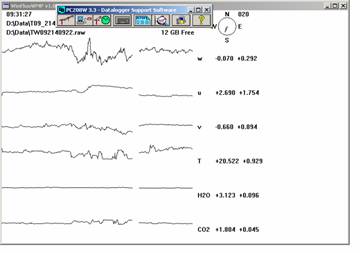
Reading from datalogger 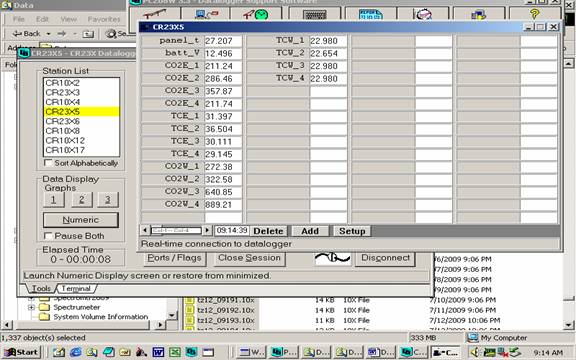 Reading from panels of analyzers
Notes: “X†means not working any more. Dendrometers installed by Gretchen group 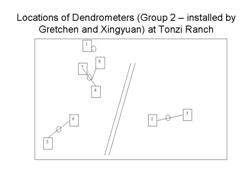 | ||||||||||||||||||||||||||||||||||||||||||||||||||||||||||||||||||||||||||||||||||||||||||||||||||||||||||||||||||||||||||||||||||||||||||||||||||||||||||||||||||||||||||||||||||||||||||||||||||||||||||||||||||||||||||||||||||||||||||||||||||||||||||||||||||||||||||||||||||||||||||||||||||||||||||||||||||||||||||||||||||||||||||||||||||||||||||||||||||||||||||||||||||||||||||||||||||||||||||||
Field Data
No tank data
Well Depth
| Date | Location | Depth (feet) |
|---|---|---|
| 2009-08-02 | TZ_floor | 27.9 |
| 2009-08-02 | TZ_road | 36.87 |
| 2009-08-02 | TZ_tower | 32.46 |
No TZ Moisture Point data found
No VR Moisture Point data found
No TZ grass heigth found
No VR grass heigth found
No TZ Tree DBH found
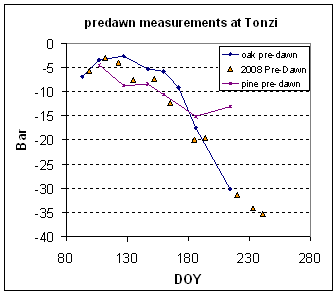
Water Potential - mode: raw
| Time | Species | Tree | readings (bar) | ||||||||
|---|---|---|---|---|---|---|---|---|---|---|---|
| 2009-08-02 04:32:00 | OAK | UNKNOWN | -30 | -43 | -38.5 | -37.5 | -41 | -37 | -12 | -19 | -14 |
| 2009-08-02 04:32:00 | PINE | UNKNOWN | -20 | -21 | -19.5 | -25 | |||||
| 2009-08-02 04:32:00 | PINE | YNG | -11 | -5.5 | -4.5 | -5.5 | -6.5 | ||||
| 2009-08-02 12:06:00 | OAK | UNKNOWN | -45 | -46 | -46.5 | -41 | -52 | -50 | -35 | -44 | -36 |
| 2009-08-02 12:06:00 | PINE | YNG | -6 | -25 | -4 | -1 | -28 | ||||
| 2009-08-02 12:06:00 | PINE | UNKNOWN | -19.5 | -5 | -7.9 | -26.5 | |||||
No TZ Grass Biomass data found
No TZ OakLeaves Biomass data found
No TZ PineNeedles Biomass data found
0 photos found
16 sets found
No data found for TZ_Fenergy.
11 TZ_tmet graphs found
11 TZ_soilco2 graphs found
Can't check TZ_mixed
3 TZ_mixed graphs found
No data found for TZ_fflux.
8 TZ_fmet graphs found
No data found for TZ_tram.
3 TZ_co2prof graphs found
No data found for TZ_irt.
No data found for TZ_windprof.
No data found for TZ_tflux.
2 TZ_sm graphs found
Can't check TZ_met
1 TZ_met graphs found
Can't check TZVR_mixed
No data found for TZ_osu.
No data found for TZ_fd.
Tonzi Z-cam data