Field Notes
<--2012-03-21 09:00:00 | 2012-04-19 09:30:00-->Other sites visited today: Tonzi | Tonzi
Phenocam link: Searching...
Vaira: 2012-04-05 09:30:00 (DOY 96)
Author: Joe Verfaillie
Others: Siyan, Martin
Summary: AM16/32 offset again, added ground wire to soil CO2 cr10x, brought in N2 tank from Ameriflux comparison. Green grass and trees.
| Vaira
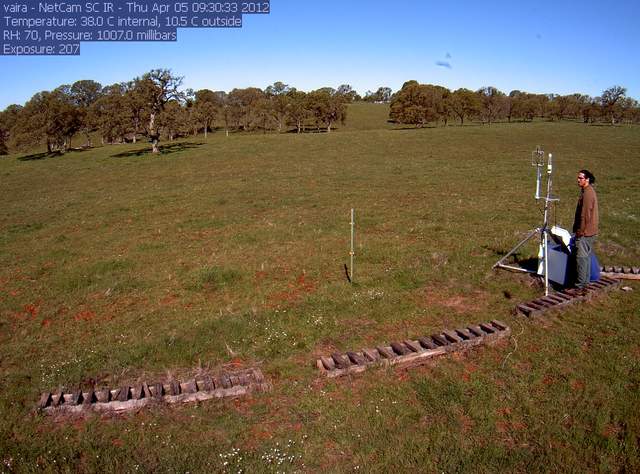
2012-04-05 I arrived about 9:30PDT with Siyan and Martin after dropping Laurie off at Tonzi. It was cool but mostly clear and sunny with a breeze from the west. Everything is very green. There are puddles in the road and the water hole is full to overflowing. Most of the trees have their leaves – maybe about 70% full. The AM16/32 was offset again. Cycling the power on the CR23X fixed it. Siyan says that the data is shifted by one column. I need to look at the code to see if there is a problem there. I put a ground wire on the soil CO2 CR10X and downloaded the data. I brought in the N2 tank that was brought out for the Ameriflux inter-comparison. The radiation sensors and tipping bucket were clear. The pyranometer has condensation in it. I think it is a bad seal somewhere. |
Field Data
No tank data
Well Depth
| Date | Location | Depth (feet) |
|---|---|---|
| 2012-04-05 | TZ_floor | 26.9 |
| 2012-04-05 | TZ_road | 35.5 |
| 2012-04-05 | TZ_tower | 31.3 |
No TZ Moisture Point data found
No VR Moisture Point data found
No TZ grass heigth found
No VR grass heigth found
No VR Tree DBH found
No water potential data found
No VR Grass Biomass data found
No VR OakLeaves Biomass data found
No VR PineNeedles Biomass data found
2 photos found

vaira_2012_04_05_093102.jpg ( 2012-04-05 10:29:58 ) Full size: 1296x960
Site visit - Martin, Joe

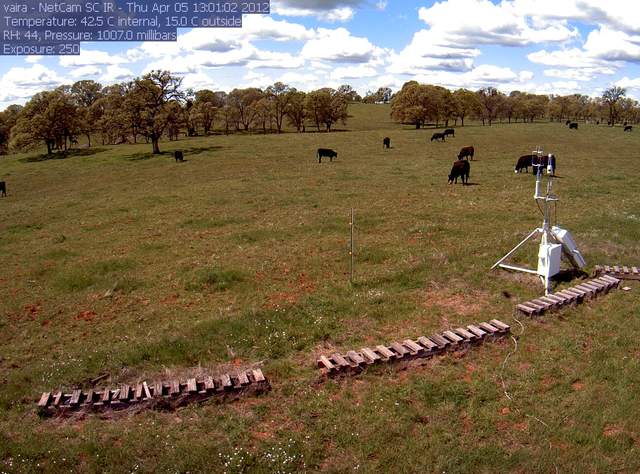
vaira_2012_04_05_130102.jpg ( 2012-04-05 13:59:58 ) Full size: 1296x960
Cows
9 sets found
16 VR_met graphs found
2 VR_flux graphs found
6 VR_soilco2 graphs found
No data found for VR_pond.
Can't check TZVR_mixed
No data found for VR_fd.
No data found for VR_processed.
No data found for VR_arable.
No data found for VR_soilvue.

