
Field Notes
<--2011-12-01 09:00:00 | 2011-12-18 00:00:00-->Other sites visited today: Twitchell Rice | Vaira | Tonzi
Phenocam link: Searching...
Tonzi: 2011-12-01 10:00:00 (DOY 335)
Author: Joe Verfaillie
Others: Siyan, Laurie, Erika
Summary: Check Stardot, replace SFH5, brought sap flow serial lines out of the trees, fixed sap flow west and south.
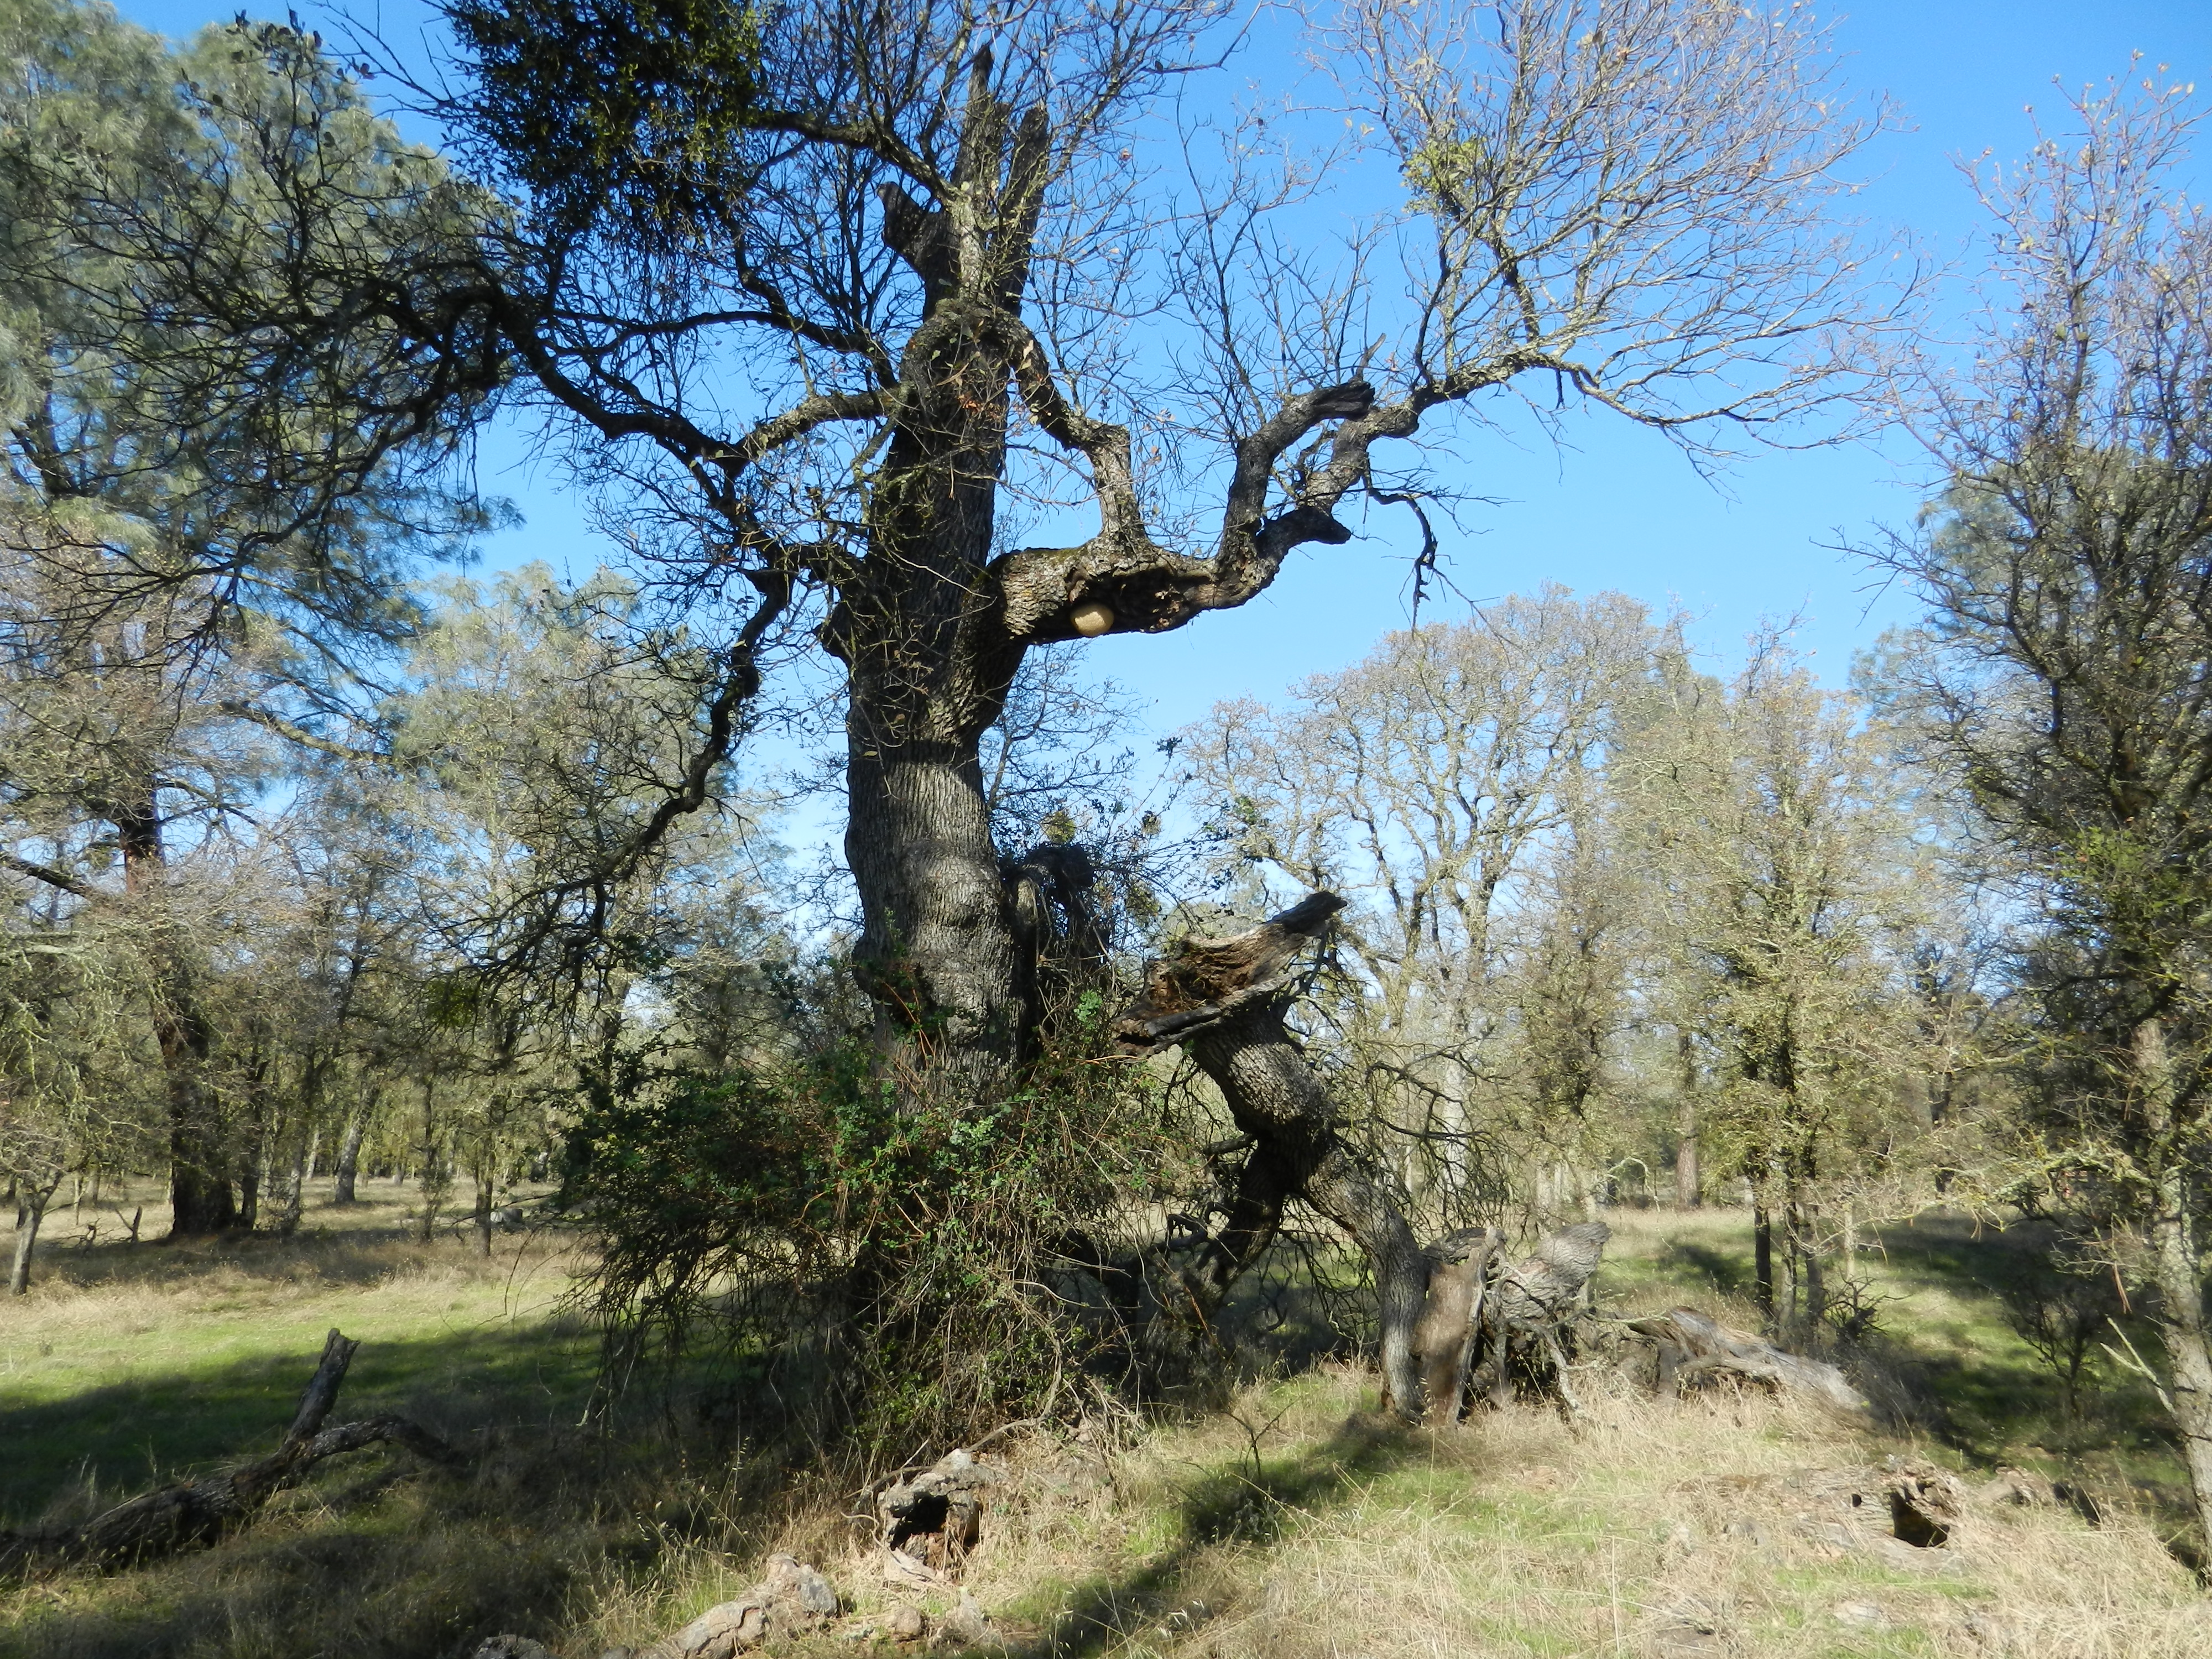
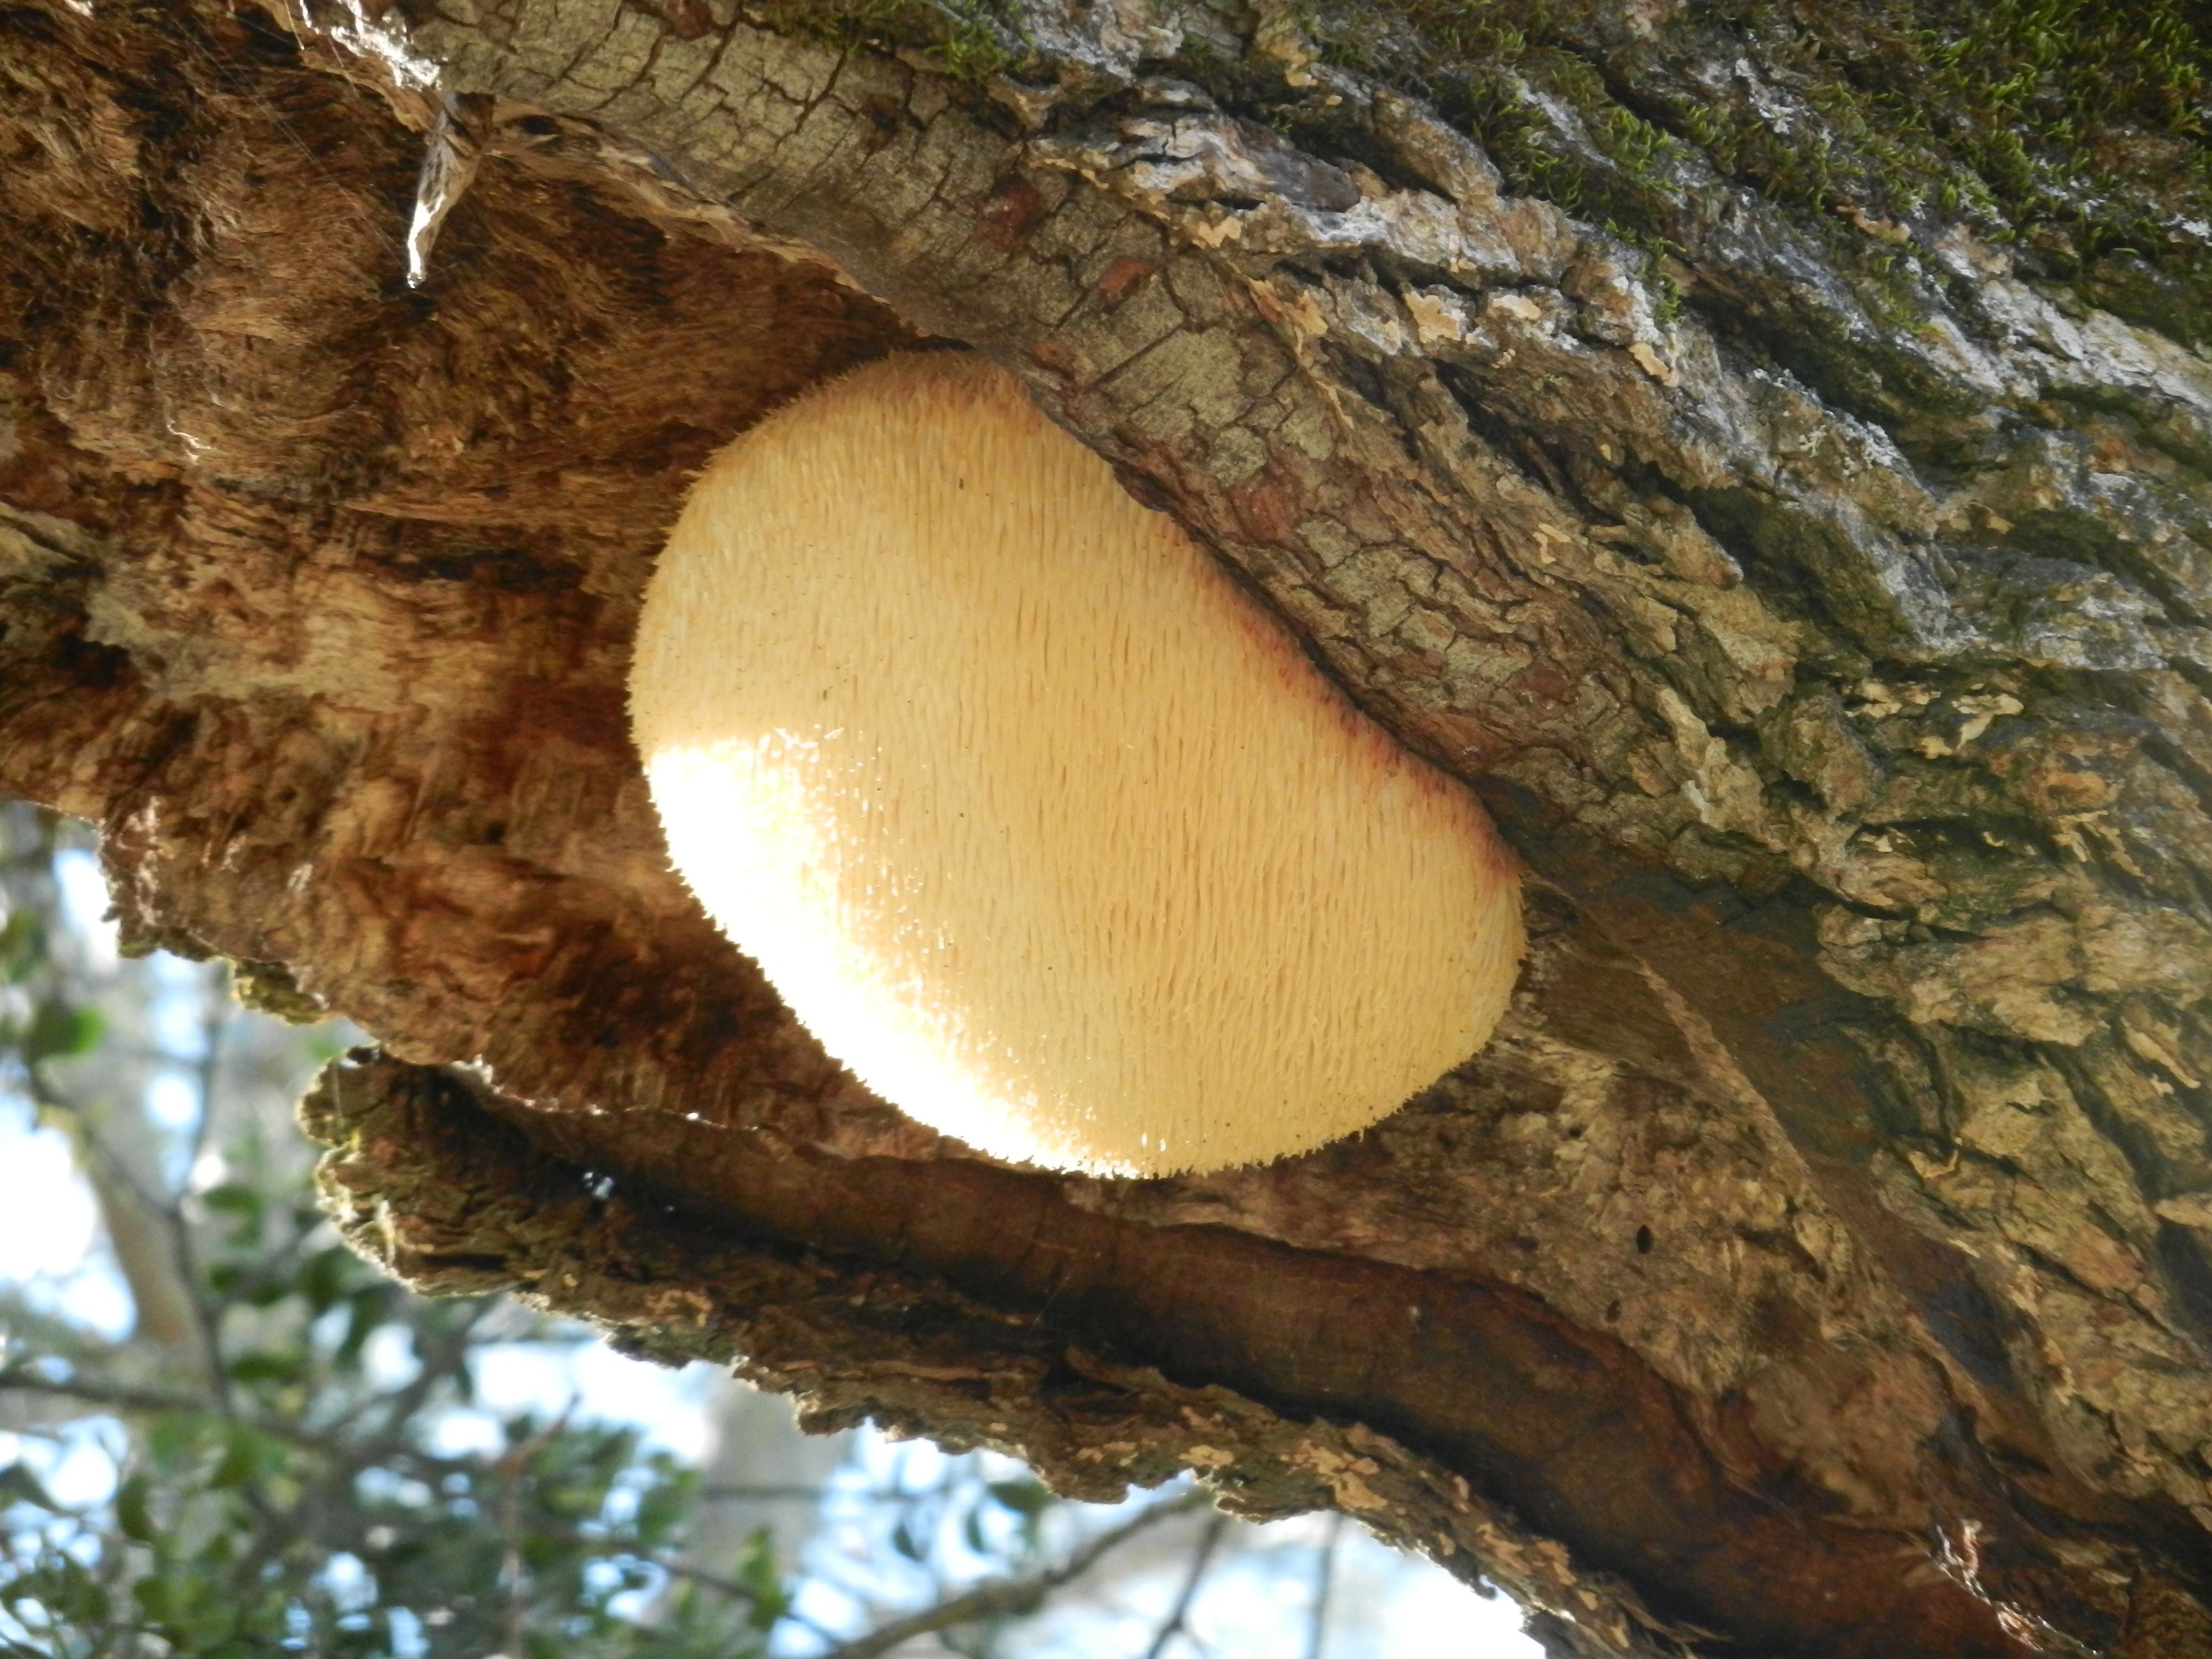
| Tonzi 2011-12-01 I arrived about 10:00 with Siyan, Laurie and Erika. It was clear and cool with strong gusty wind. The trees have lost most of their leaves. The grass is still green but doesn?t look like it has grown much. The ground is damp in low spots, but seemed dry in higher spots and under the trees. I collected the Stardot camera photos. Looks like it ran okay but a few files were zero length. I replaced SHF plate 5 sn 000144 on the under canopy met set. The one self-calibrating plate in the bunch has opposite wire colors. The tube extension I taped to the end of the co2 profile pump outlet fell off. Still need a connector for it. It was so windy today I couldn?t hear the pump from the ground. The tram had stopped. The battery was still above 12V. A power cycle sent it back to park and it then ran as normal. Maybe fighting against the wind caused the trip back to the east to time out. I inadvertently left a spare battery on the end of the track. Siyan and I went to Vaira about 11:30. Returning to Tonzi, I fished the serial lines to the North and East sap flow stations out of the trees. One of the ranchers had mentioned to me a while back that the wires were dangerous to cowboys riding through. We will see how long the lines last on the ground. I resent the program to the west sap flow station (C1) and it seemed to start functioning again. The south sap flow station (C478) had a very low battery (5V), I disconnected the heaters and the battery voltage began to climb. Maybe it will be okay after a day or two of solar power. The east sap flow station (C56) has been down for a long time. The north sap flow station (C23) has been working well. I found a soccer ball sized fungus growing on an oak branch near this station. I cleaned the z-cam windows. Siyan did the standard fieldwork, Laurie and Erika attempted to take soil and tree cores. |
Field Data
No tank data
No TZ Well data found
No TZ Moisture Point data found
No VR Moisture Point data found
No TZ grass heigth found
No VR grass heigth found
No TZ Tree DBH found
Water Potential - mode: raw
| Time | Species | Tree | readings (bar) | ||
|---|---|---|---|---|---|
| 2011-12-01 11:48:00 | OAK | UNKNOWN | -11.5 | -16 | -16 |
| 2011-12-01 11:48:00 | PINE | OLD | -21 | -21 | -6.5 |
| 2011-12-01 11:48:00 | PINE | YNG | -4 | -3.5 | -10 |
No TZ Grass Biomass data found
No TZ OakLeaves Biomass data found
No TZ PineNeedles Biomass data found
6 photos found
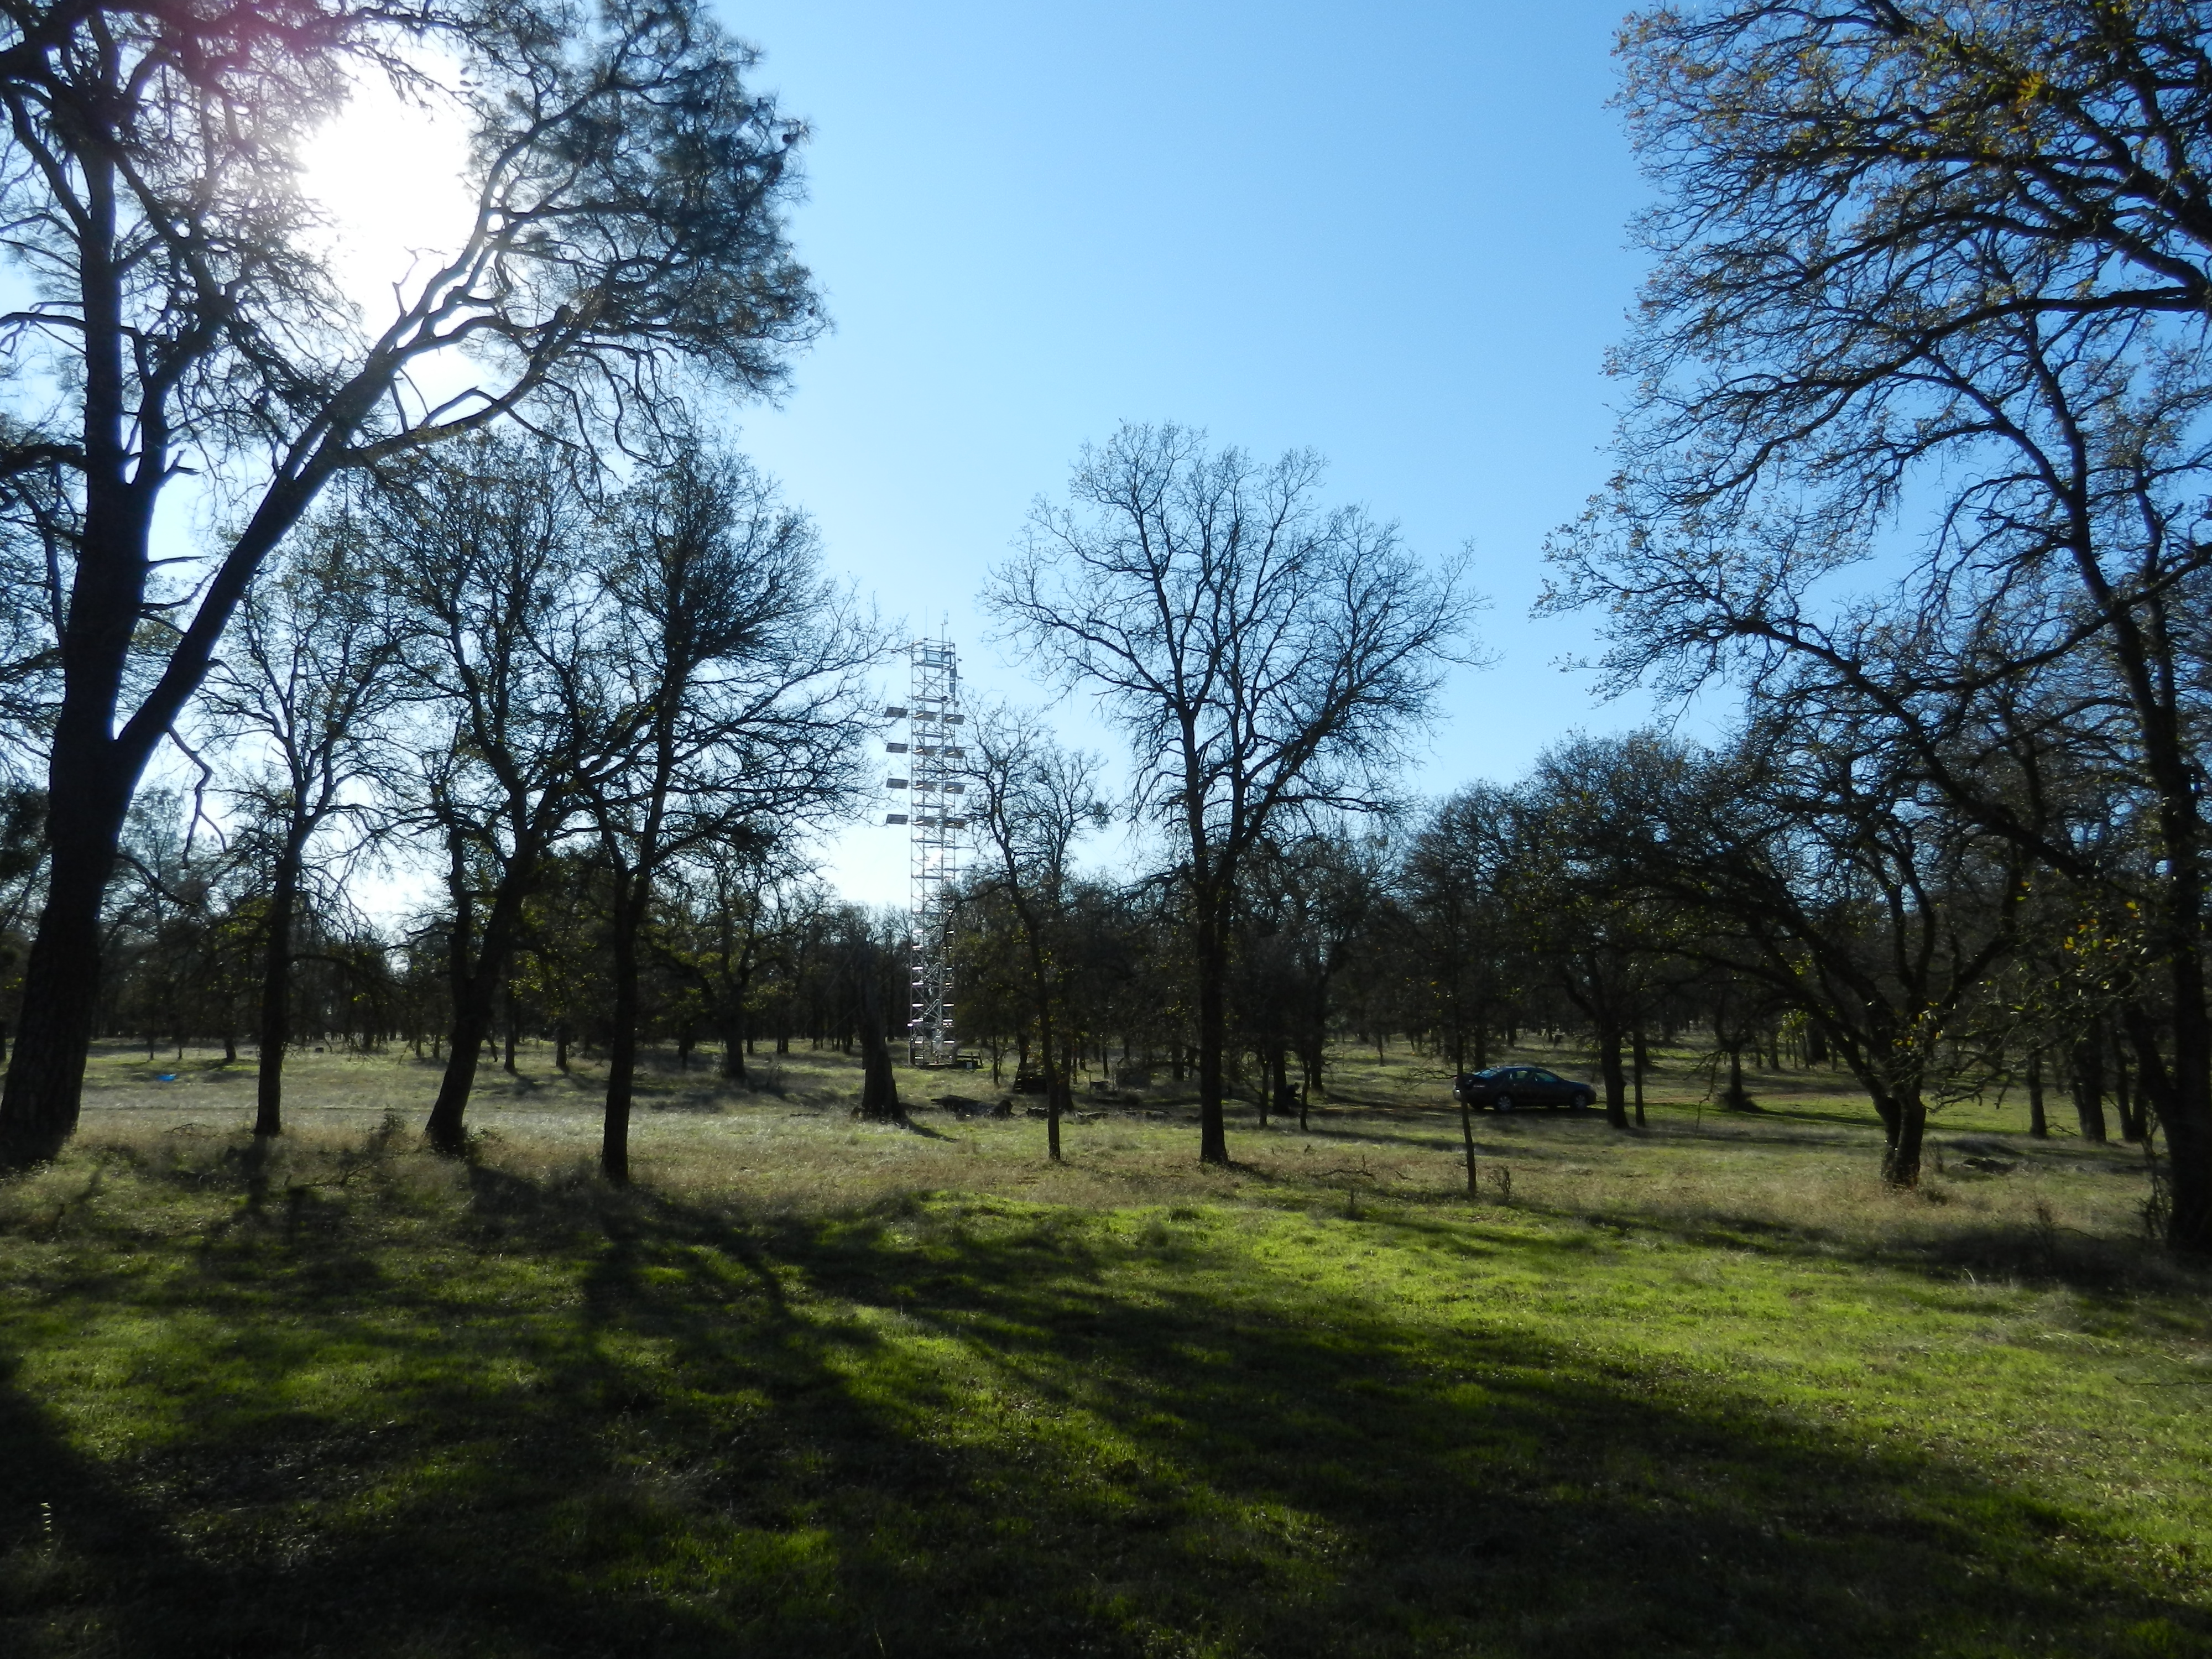
20111201TZ_Tower.jpg ( 2011-12-01 14:21:27 ) Full size: 4000x3000
Green grass at Tonzi with the tower in the background
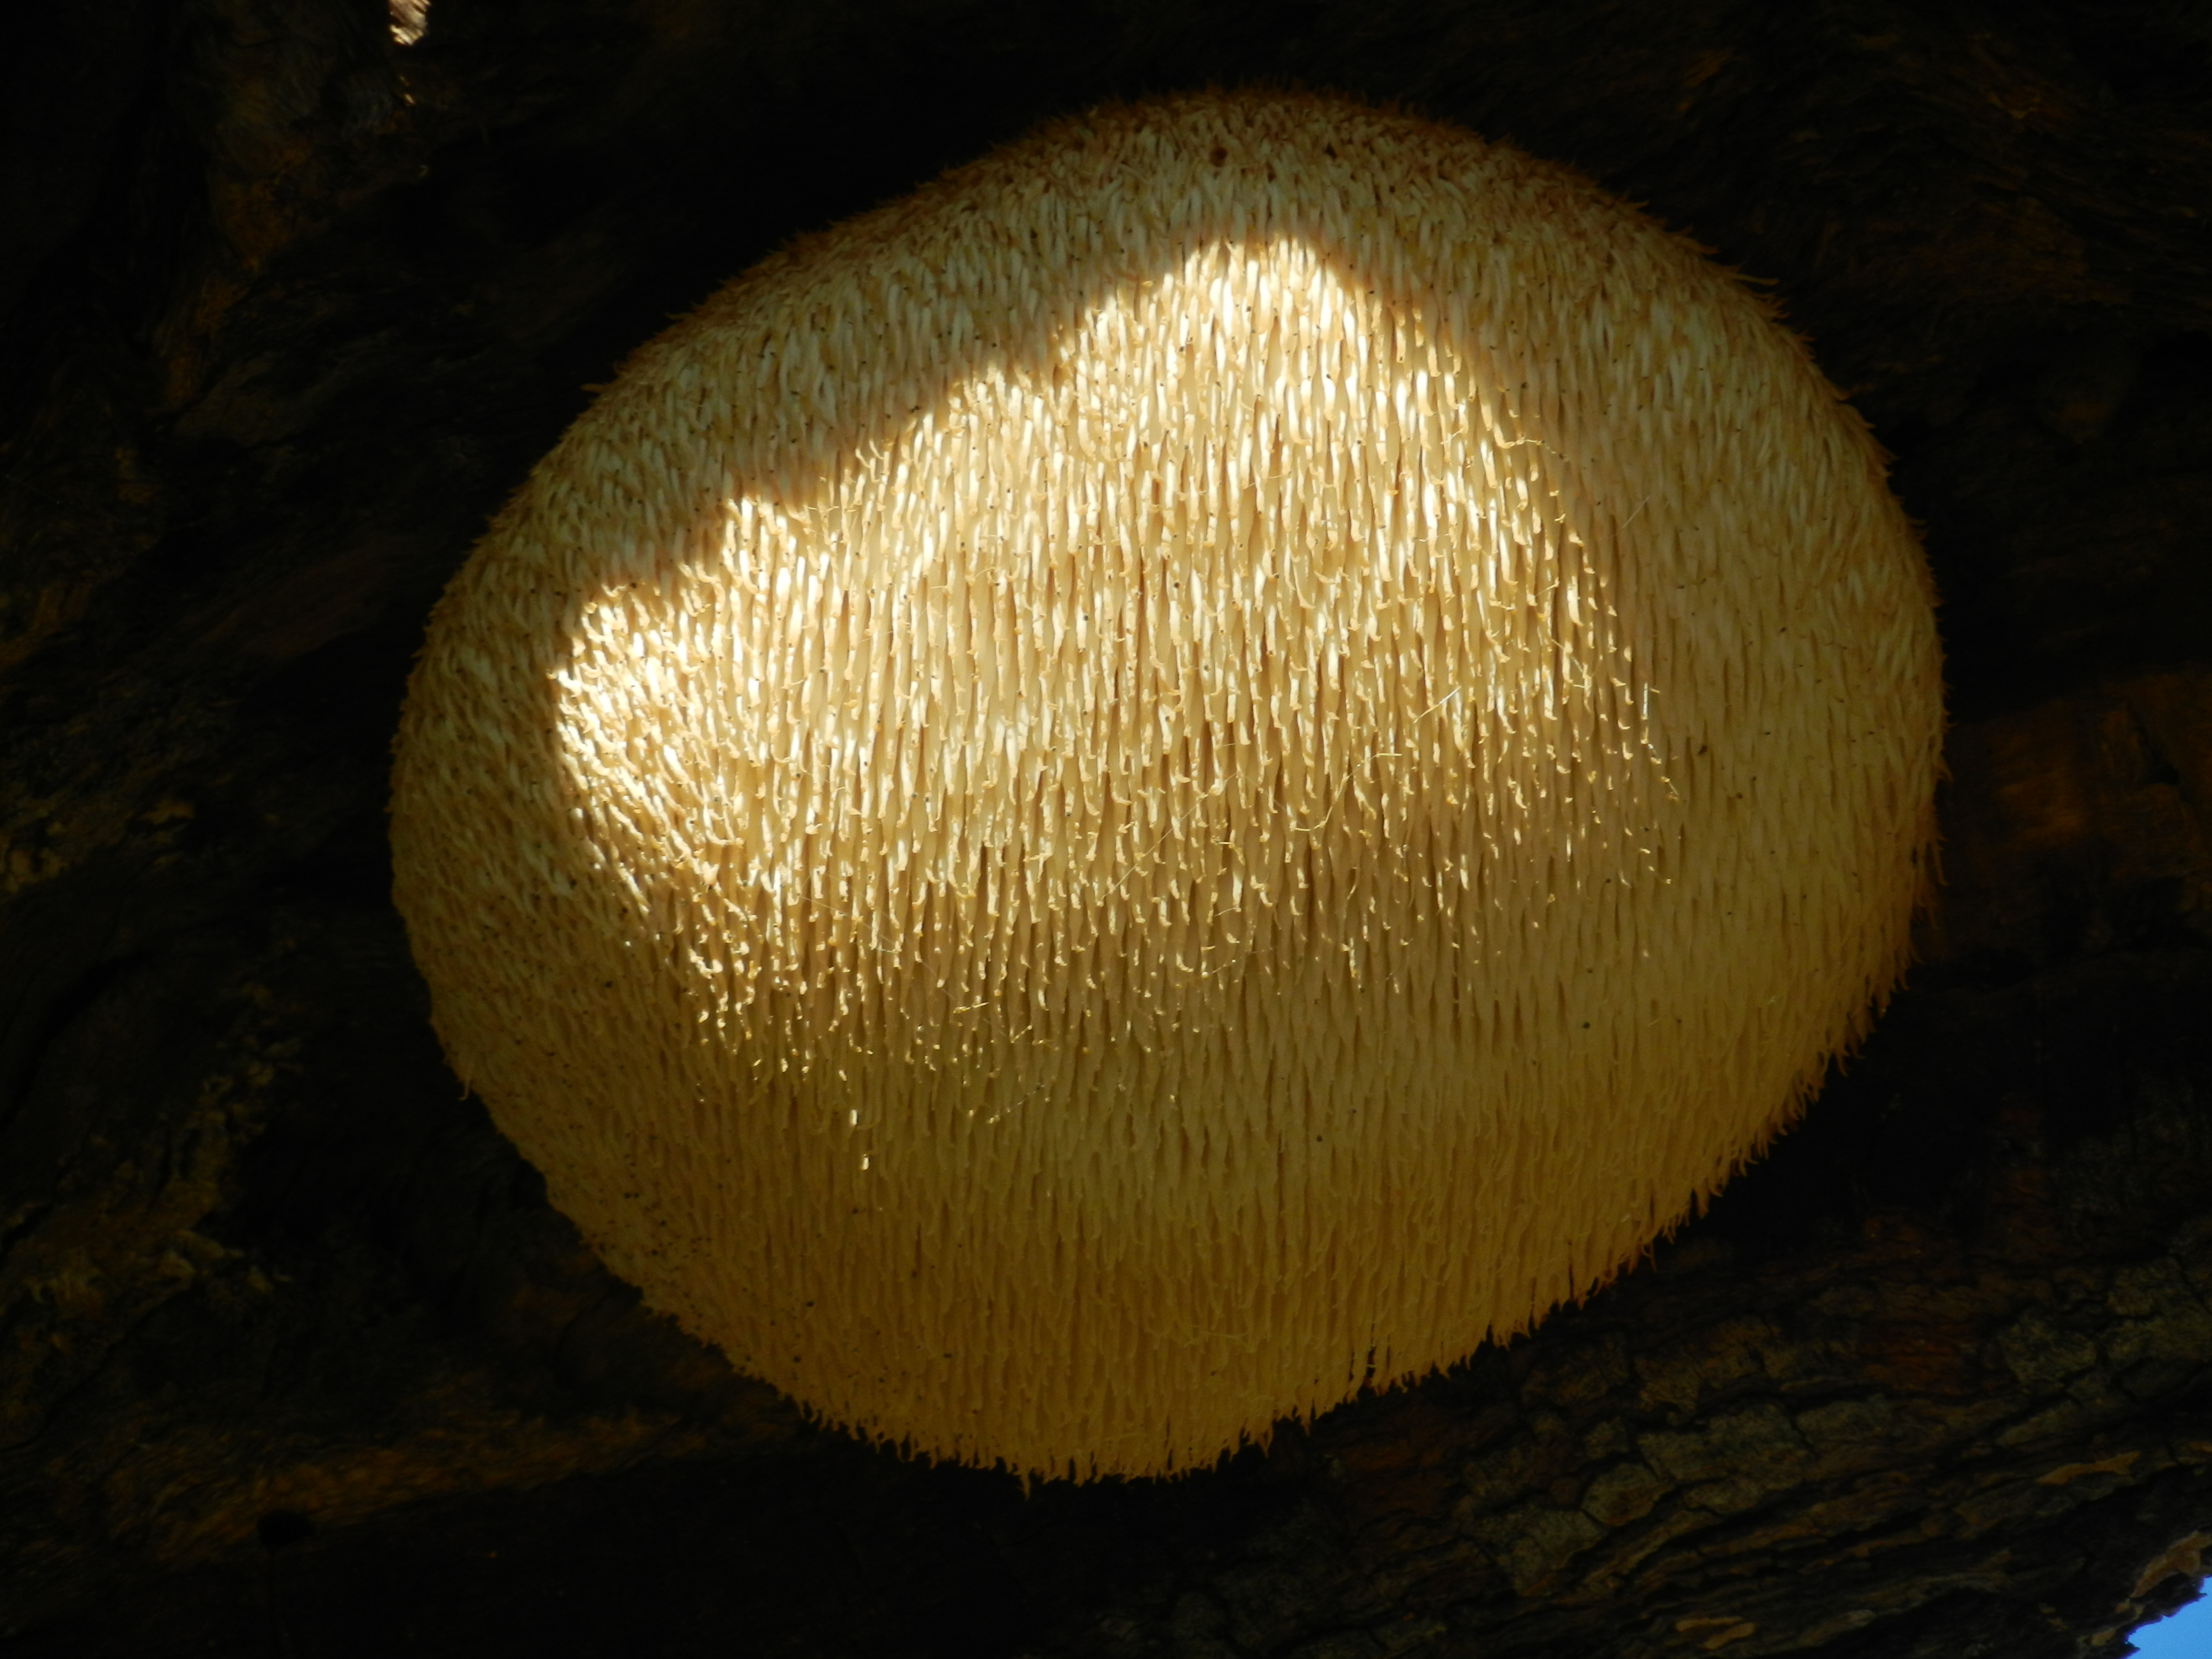
20111201TZ_TreeFungus1.jpg ( 2011-12-01 14:15:42 ) Full size: 4000x3000
Lion's mane fungus on oak tree
20111201TZ_TreeFungus2.jpg ( 2011-12-01 14:16:12 ) Full size: 4000x3000
Lion's mane fungus on oak tree
20111201TZ_TreeFungus3.jpg ( 2011-12-01 14:16:35 ) Full size: 4000x3000
Lion's mane fungus on oak tree
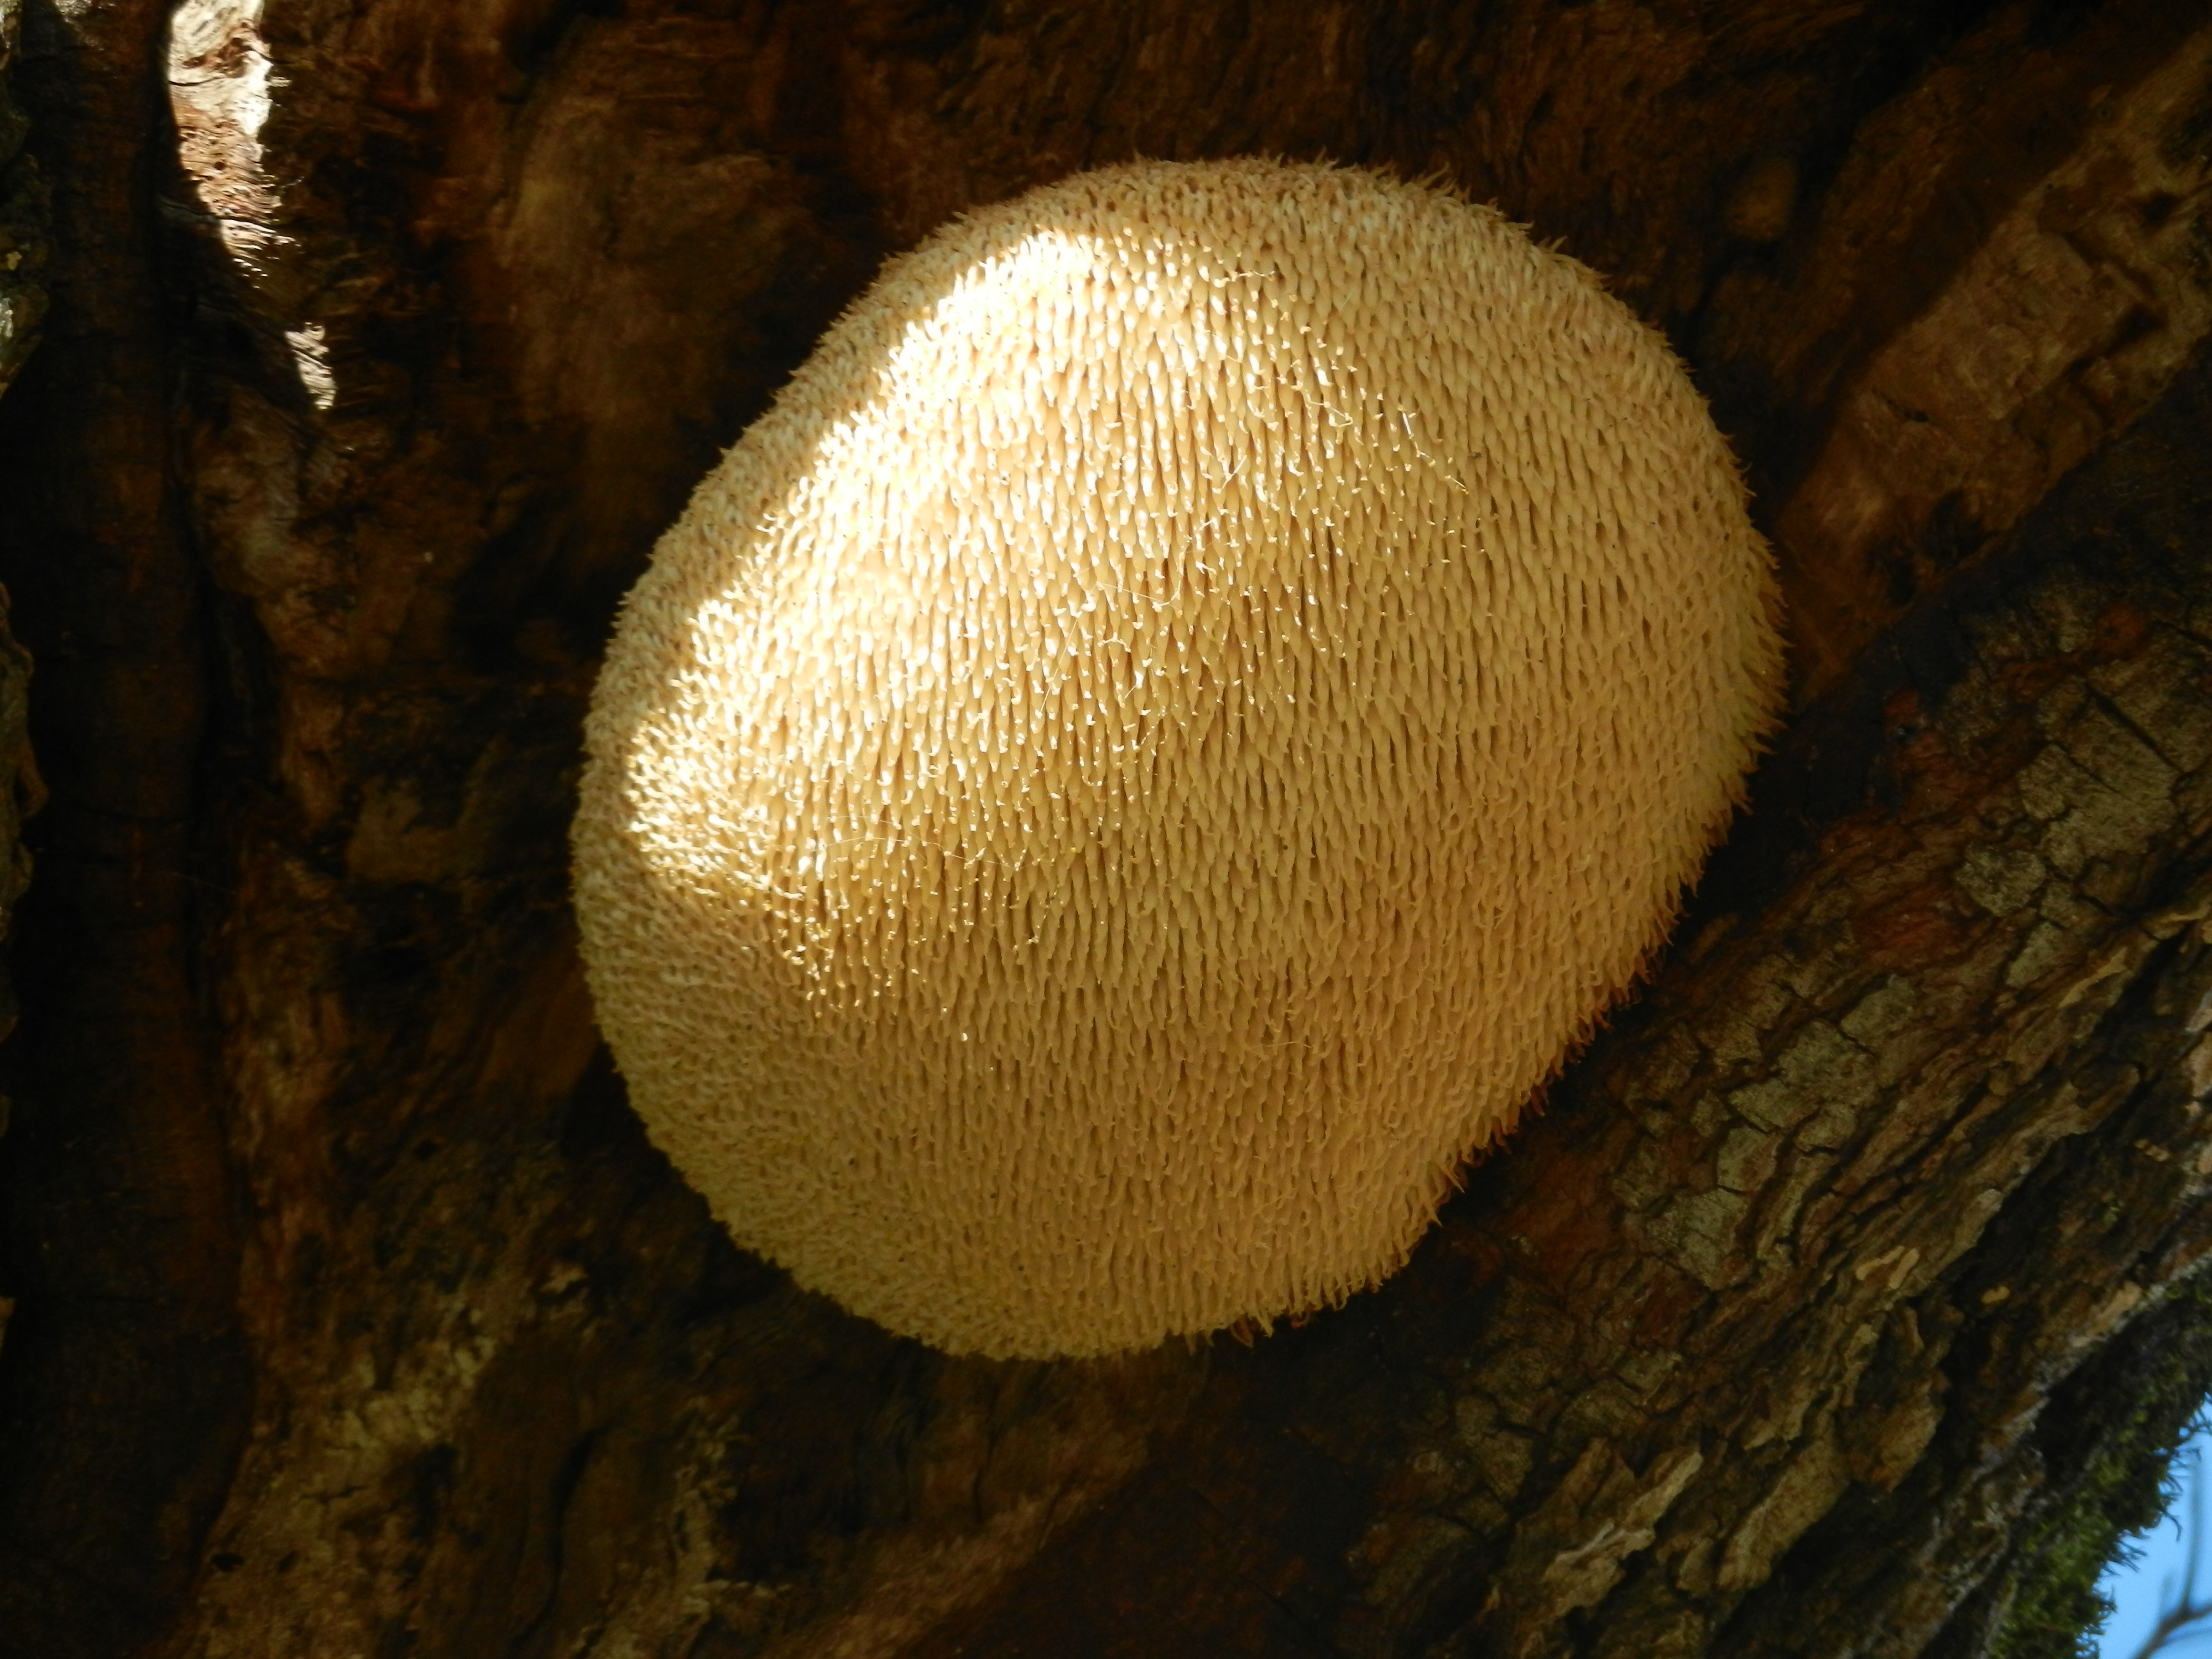
20111201TZ_TreeFungus4.jpg ( 2011-12-01 14:17:21 ) Full size: 4000x3000
Lion's mane fungus on oak tree
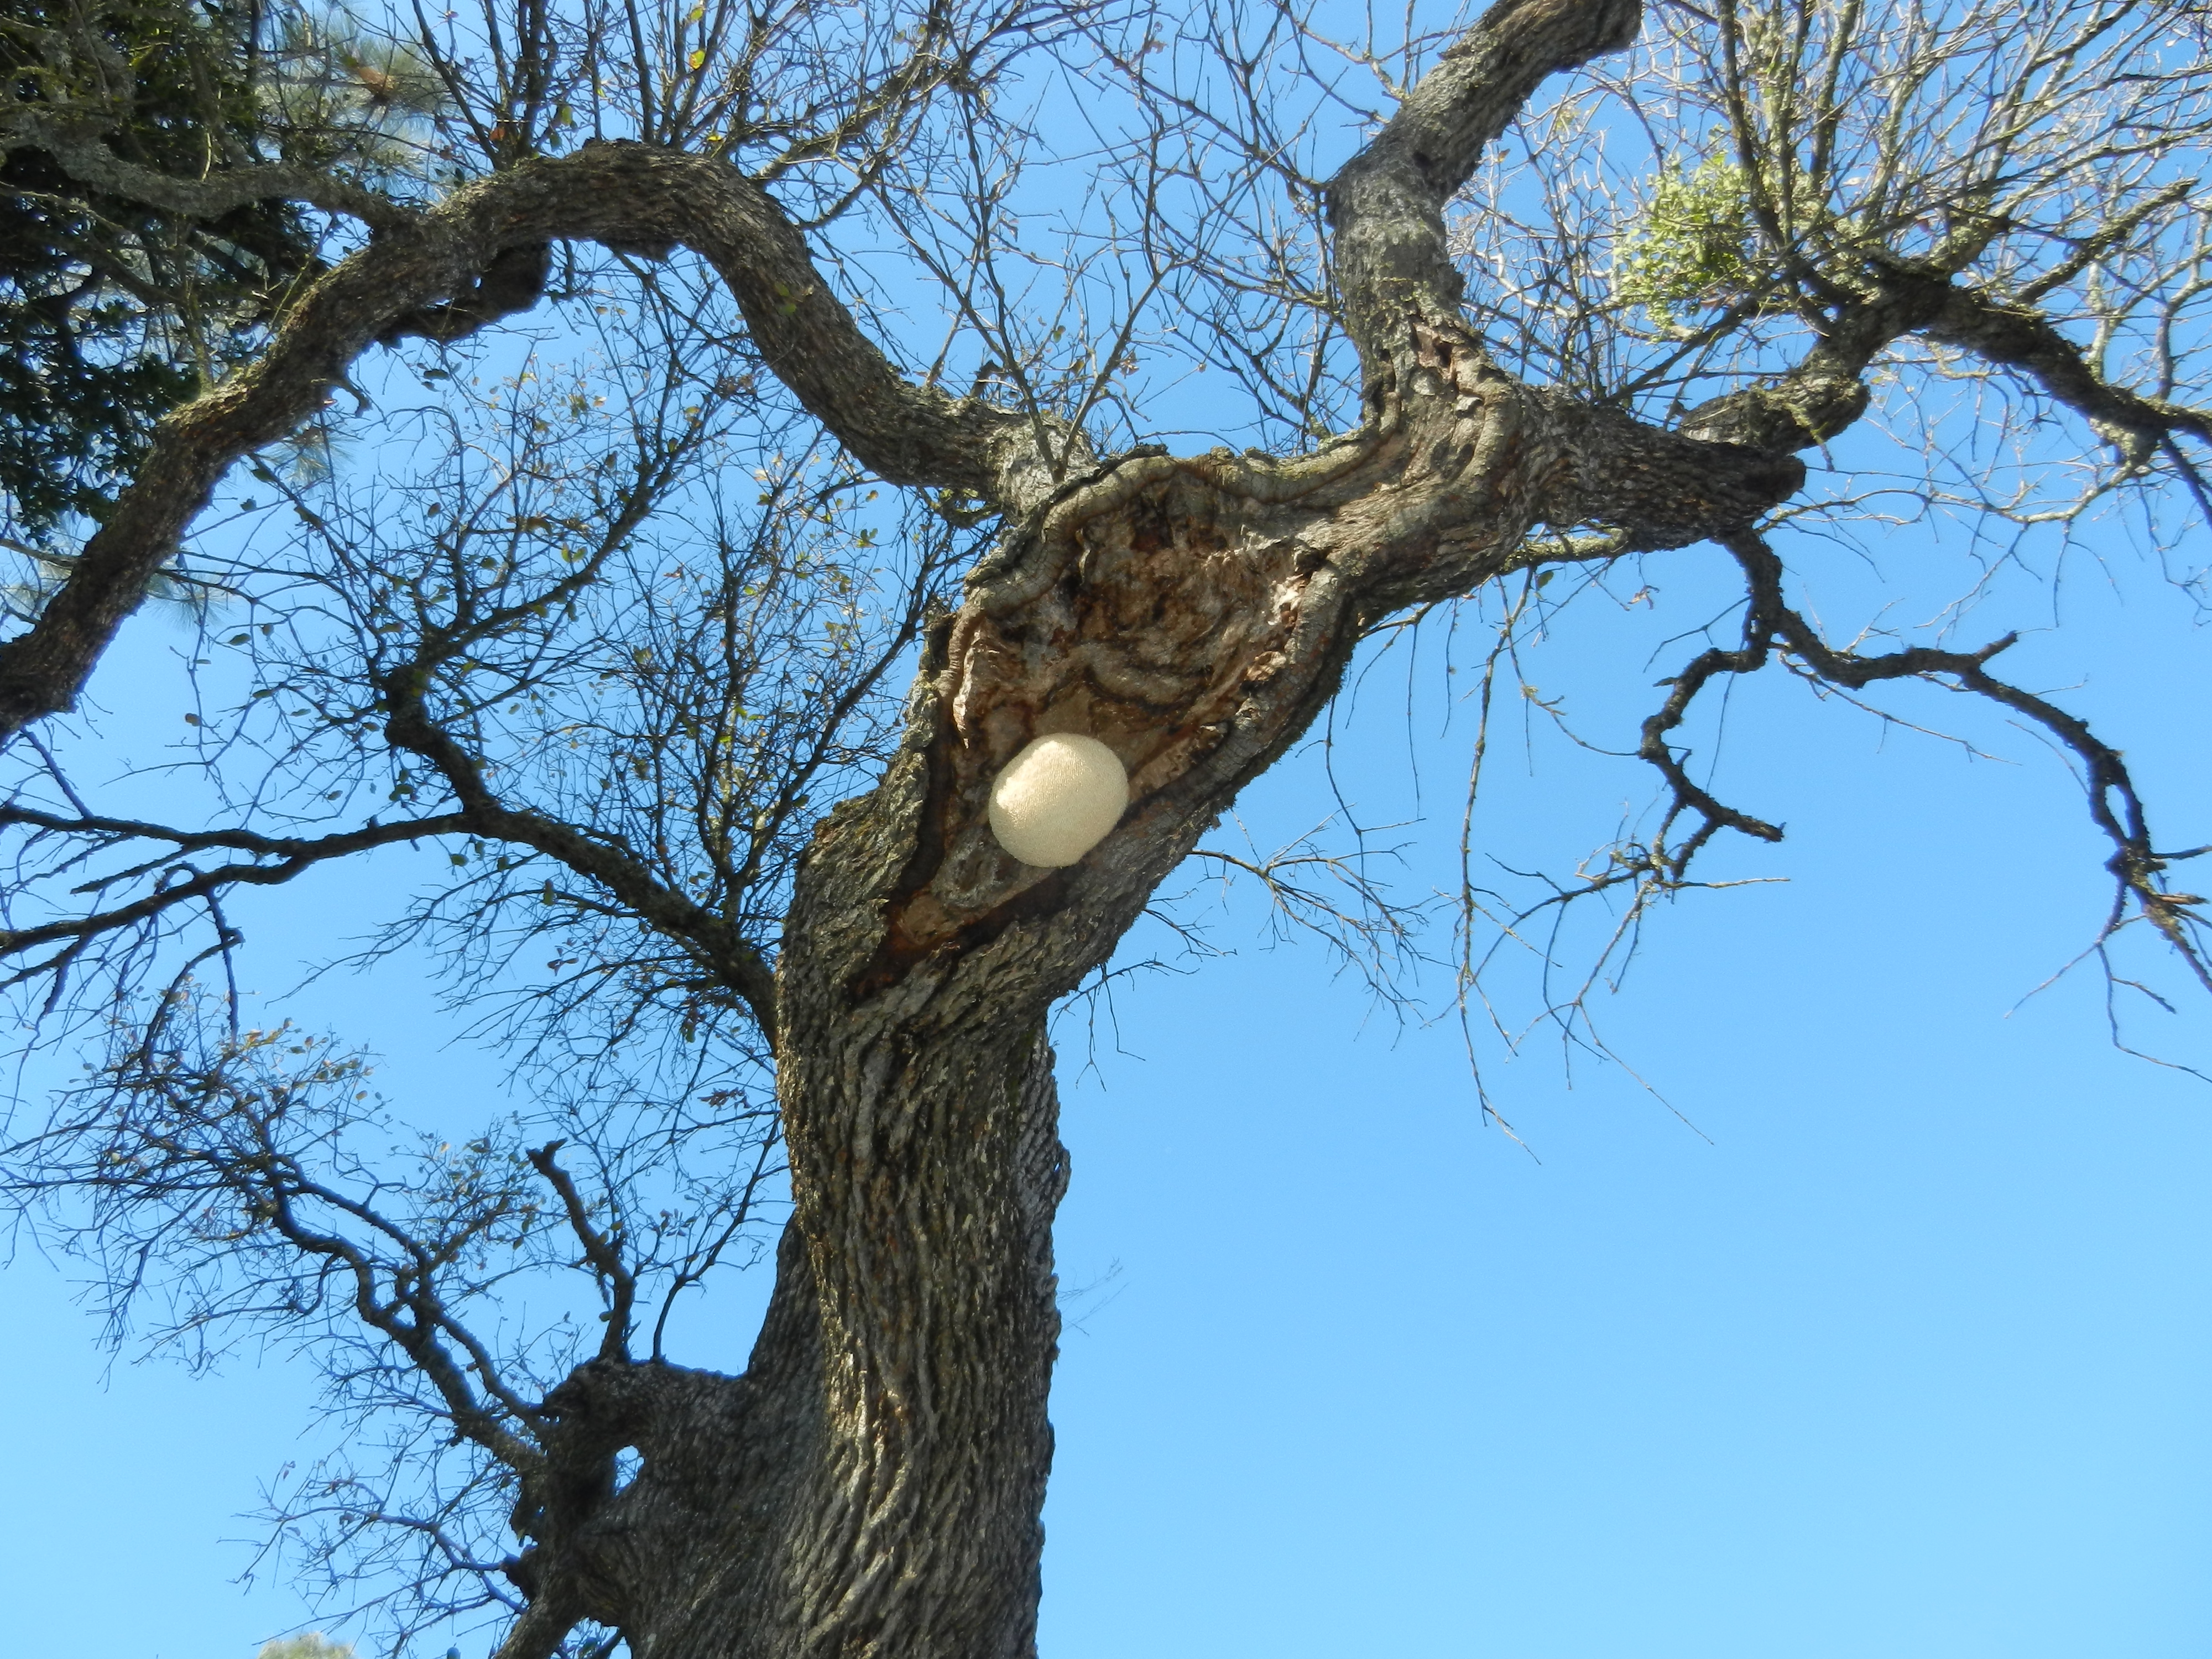
20111201TZ_TreeFungus5.jpg ( 2011-12-01 14:19:10 ) Full size: 4000x3000
Lion's mane fungus on oak tree
16 sets found
No data found for TZ_Fenergy.
11 TZ_tmet graphs found
11 TZ_soilco2 graphs found
Can't check TZ_mixed
3 TZ_mixed graphs found
1 TZ_fflux graphs found
8 TZ_fmet graphs found
1 TZ_tram graphs found
3 TZ_co2prof graphs found
No data found for TZ_irt.
No data found for TZ_windprof.
1 TZ_tflux graphs found
2 TZ_sm graphs found
Can't check TZ_met
1 TZ_met graphs found
Can't check TZVR_mixed
No data found for TZ_osu.
No data found for TZ_fd.
Tonzi Z-cam data