Field Notes
<--2011-11-16 06:30:00 | 2011-12-14 10:30:00-->Other sites visited today: Twitchell Rice | Mayberry
Phenocam link: Searching...
Sherman Island: 2011-11-22 10:15:00 (DOY 326)
Author: Joe Verfaillie
Others: Jaclyn, Sara
Summary: Standard field work
| Sherman
2011-11-22 I arrived about 10:15 with Jaclyn and Sara. The fog was lifting and the sun was beginning to peak through. It was still cool. The pepperweed looks much more yellow and dying this week. The ground seems damp perhaps from the heavy fog. I collected data. The new autocam seems to have shut is self off after a couple of days. I'm not sure why. Everything else seemed okay. Sara checked on the new Vaisala probes. The deeper one is out of range on the data logger. This can be fixed by choosing a resistor of the correct value to convert the current signal to voltage. I think currently they are using 249Ohm and should use 121Ohm resistors. Jaclyn did the standard field work |
5 photos found
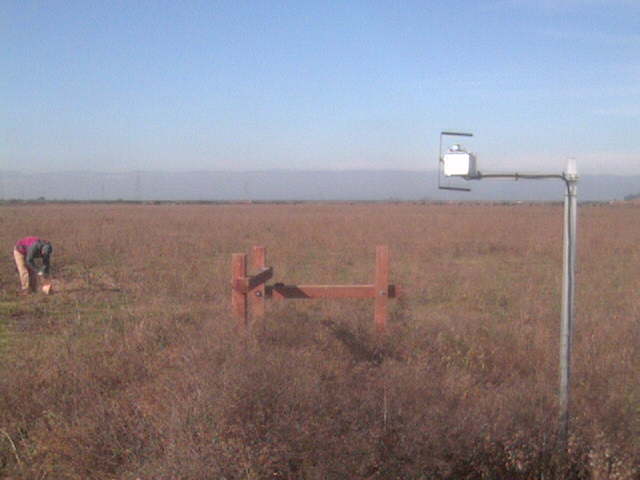
SI_webcam_20113261045.jpg ( 2011-11-22 10:45:04 ) Full size: 640x480
Site Visit.
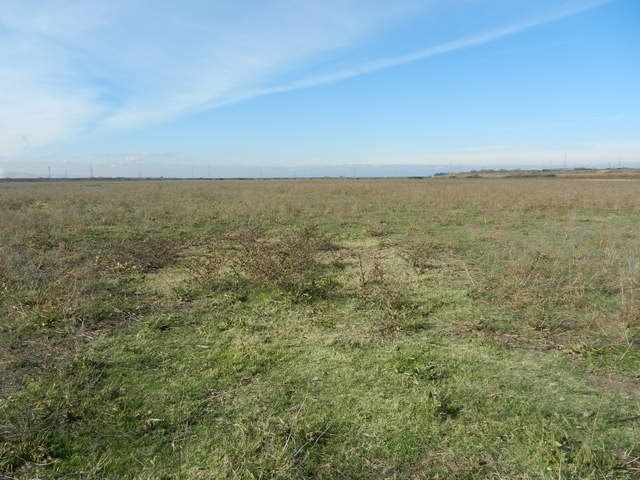
20111122SI_Field.jpg ( 2011-11-22 12:28:49 ) Full size: 4000x3000
Some green grass in the cow pasture
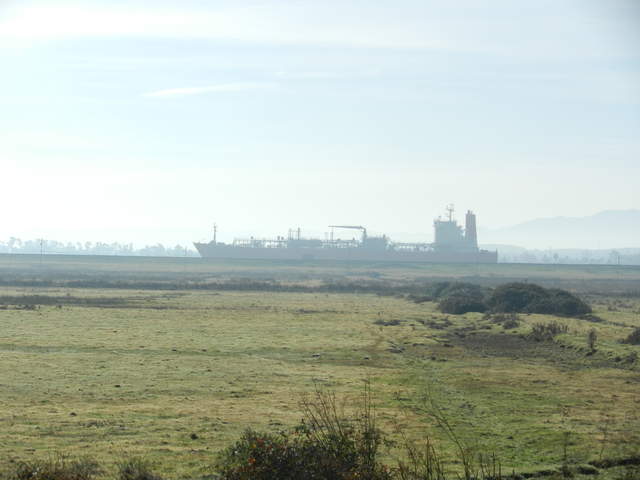
20111122SI_Ship.jpg ( 2011-11-22 11:30:15 ) Full size: 4000x3000
Ship on the river above the cow pastures
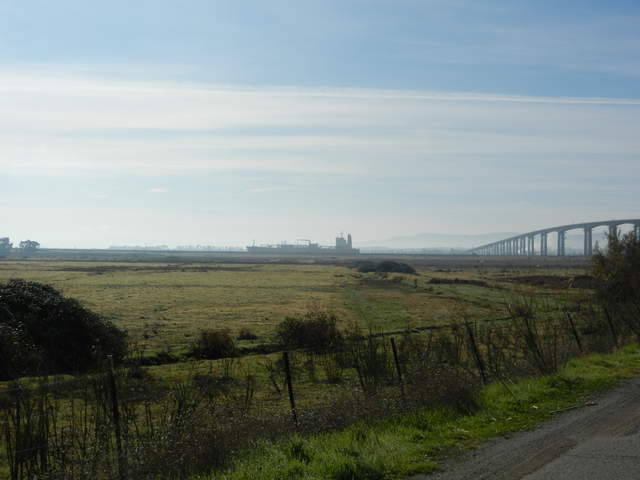
20111122SI_ShipAndBridge.jpg ( 2011-11-22 11:30:22 ) Full size: 4000x3000
Ship passing just upstream of the Antioch Bridge
20111122SI_Tower.jpg ( 2011-11-22 12:28:37 ) Full size: 4000x3000
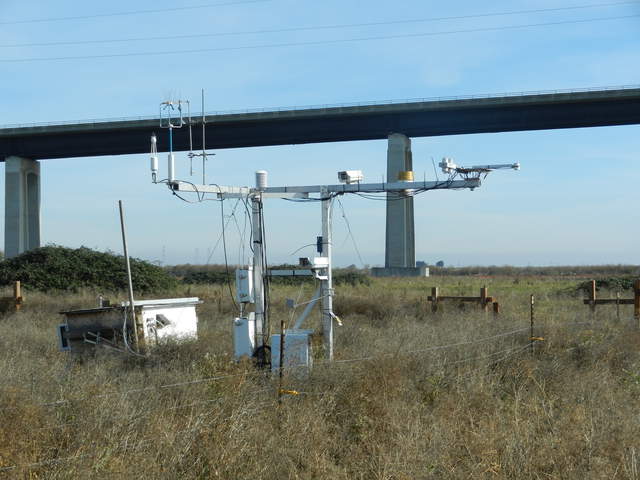
A view on the cow pasture eddy tower with the bridge in the background
7 sets found
1 SI_mp graphs found
11 SI_met graphs found
Can't check SI_mixed
2 SI_mixed graphs found
5 SI_flx graphs found
2 SI_soilco2 graphs found
Can't check TWSI_mixed
Can't check SIMBTWEE_met

