Field Notes
<--2011-11-16 08:00:00 | 2011-12-01 08:30:00-->Other sites visited today: Sherman Island | Mayberry
Phenocam link: Searching...
Twitchell Rice: 2011-11-22 09:30:00 (DOY 326)
Author: Joe Verfaillie
Others: Jaclyn, Sara
Summary: Power down due to GFI, LGR calibration.
| Twitchell
2011-11-22 I arrived about 9:30PST with Jaclyn and Sara. It was cold and foggy with a little breeze. The fog was breaking up and the spots of sunlight were warm. The water level in the field might be a bit lower. We saw some geese, but not a lot of birds in the fields yet. The power was out again when we arrived due to the GFI outlet on the generator. I reset it and eveything came up. Jim stopped by and said that he would replace the outlet on the generator. The LGR read: 9:25PST, 7.15C, 139.03Torr, 14.361usec, 10Hz, 2.757ppm We calibrated the LGR with a 3.276ppm tank with 400psi. Last cal was Oct 10, 2011. 9:56PST, 9.53C, 156.07Torr, 14.341usec, 1Hz, 3.357ppm After cal it was right on. When we left it was back in high flow at 10Hz and pressure was about 141Torr, I did not adjust the bypass valve. Data was collected including the new autocam images. Sara washed the solar panels. Jaclyn collected water samples. |
3 photos found

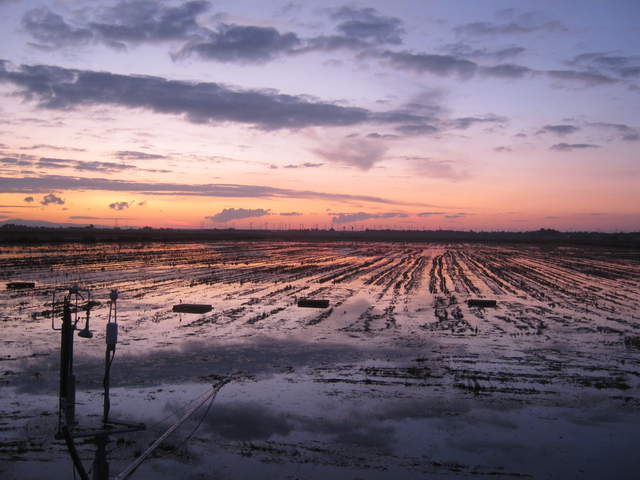
TW_autocam_20111121_1815.jpg ( 2011-11-21 18:15:02 ) Full size: 3648x2736
Nice sunset.

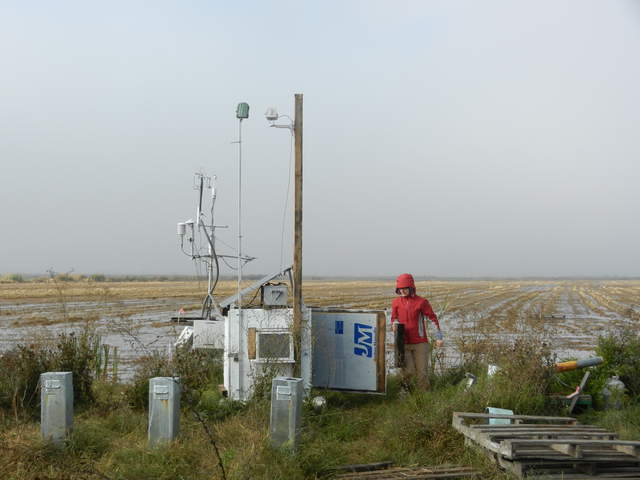
20111122TW_SaraAtSite.jpg ( 2011-11-22 11:01:51 ) Full size: 4000x3000
Sara servicing the rice tower on a gray day

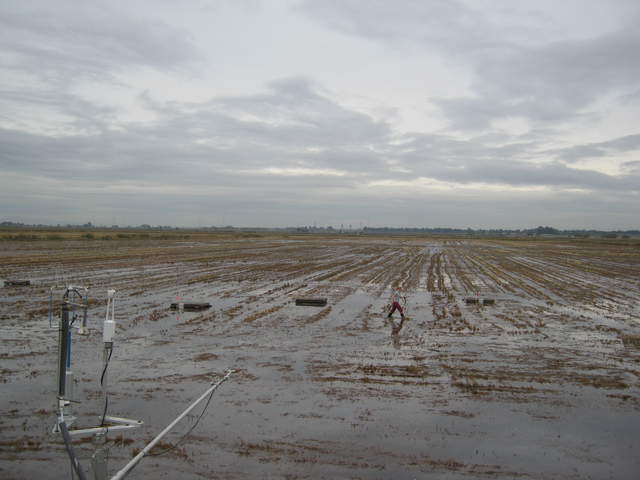
TW_autocam_20111123_1545.jpg ( 2011-11-23 15:45:02 ) Full size: 3648x2736
UC Davis on sight
6 sets found
12 TW_met graphs found
5 TW_flux graphs found
Can't check TWSI_mixed
Can't check SIMBTWEE_met
1 TW_cam graphs found
Can't check TATWBABCSB_cam

