
Field Notes
<--2011-04-22 11:00:00 | 2011-05-13 10:00:00-->Other sites visited today: Twitchell Rice | Mayberry
Phenocam link: Searching...
Sherman Island: 2011-04-26 11:00:00 (DOY 116)
Author: Joe Verfaillie
Others: Jaclyn
Summary: Removed broken SHF plate #2, broke and fixed soil moisture #2, changed CR1000 program.
| Sherman
4/26/2011 I arrived about 11am with Jaclyn. It was clear and sunny with a breeze from the west. Pepper weed and other grass and herbs are still growing slowly in the field. Inside the cow fence is a jungle. The water in the ditch along the road is still as low as I have ever seen. I collected data from the met data logger and the web cam, and swapped cards on the CR1000. I changed the program on the CR1000 to remove the old LGR channels. Seems the fast radiation data logger is not working. I could not connect to the data logger either from the site computer or from a netbook. The data logger seems to have power, lots of dead ants in the box. I did not see at value in the field, but the data does not show any lost or bad diffuse PAR. So the CR10X seems to be still working but I cannot talk to it. Soil heat flux #2 has not been working. In trying to find SHF #2 I disconnected soil moisture #2 and reconnected it. Finally I found SHF #2 and discovered that the cable insulation has rotted away. I pulled it out and brought in in. I removed the gas regulator from the box for eventual use at Mayberry. |
2 photos found
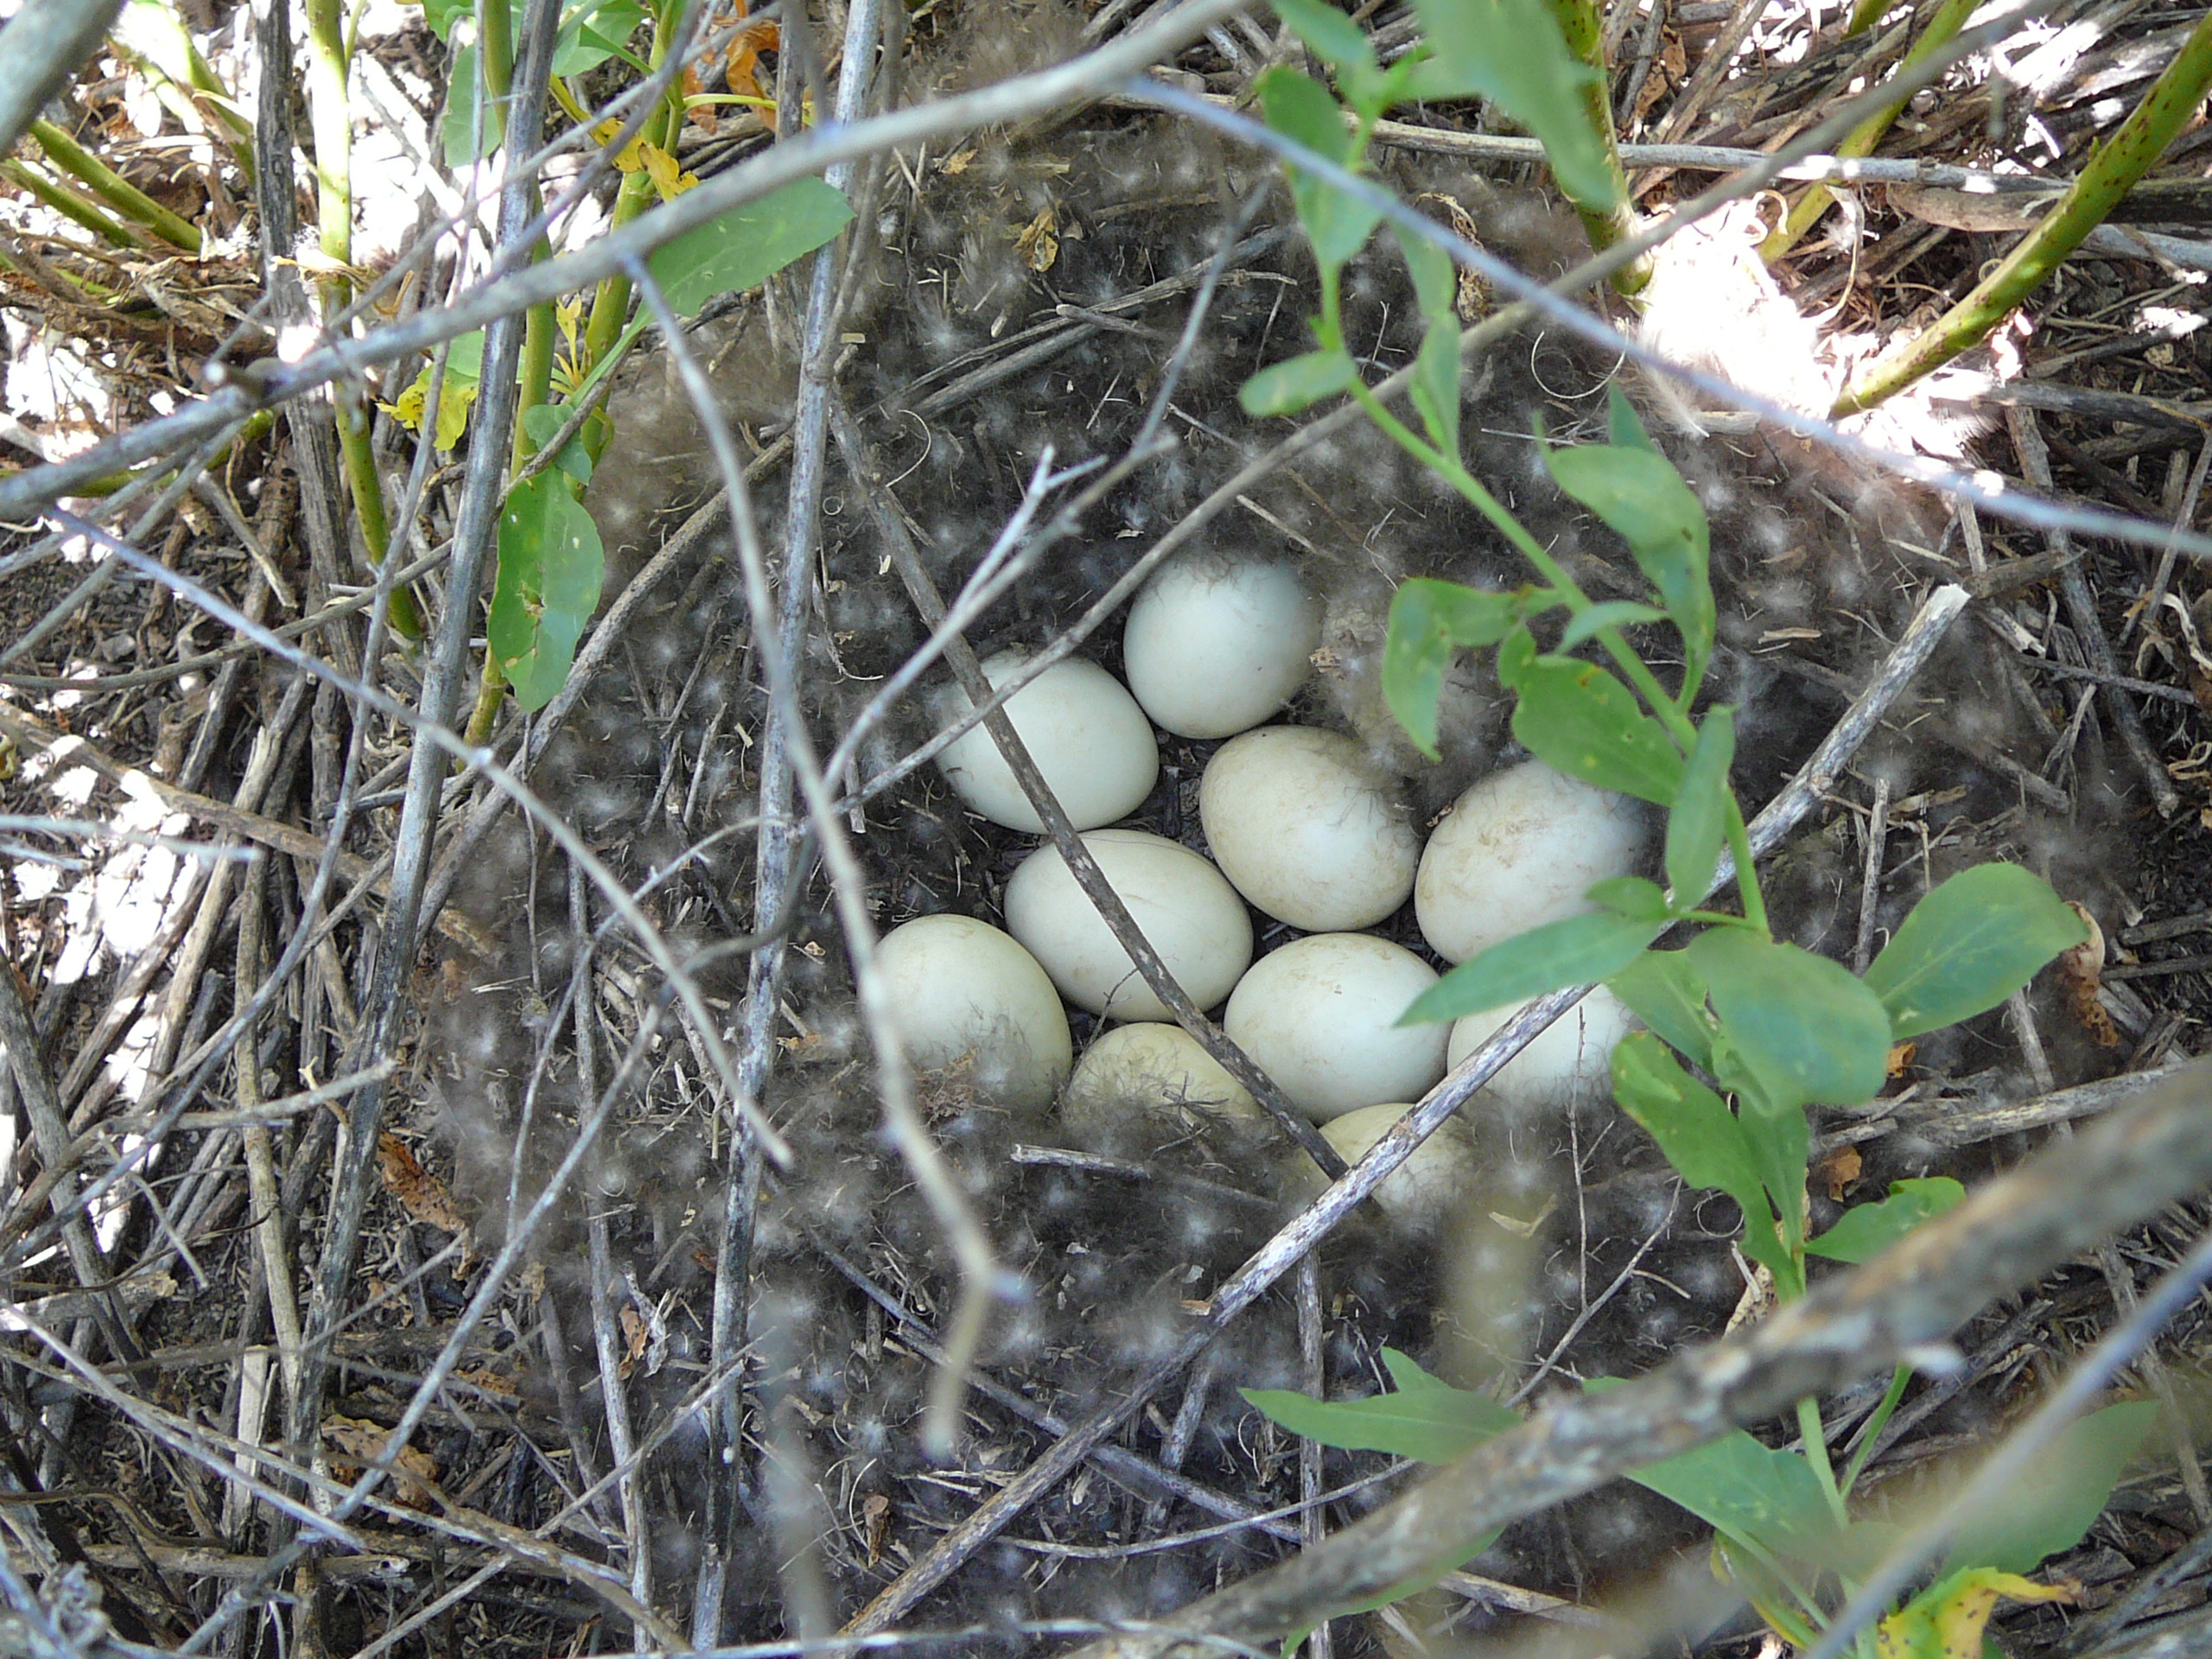
20110426SI_MallardEggs.jpg ( 2011-04-26 11:01:06 ) Full size: 2560x1920
A nest full of mallard eggs
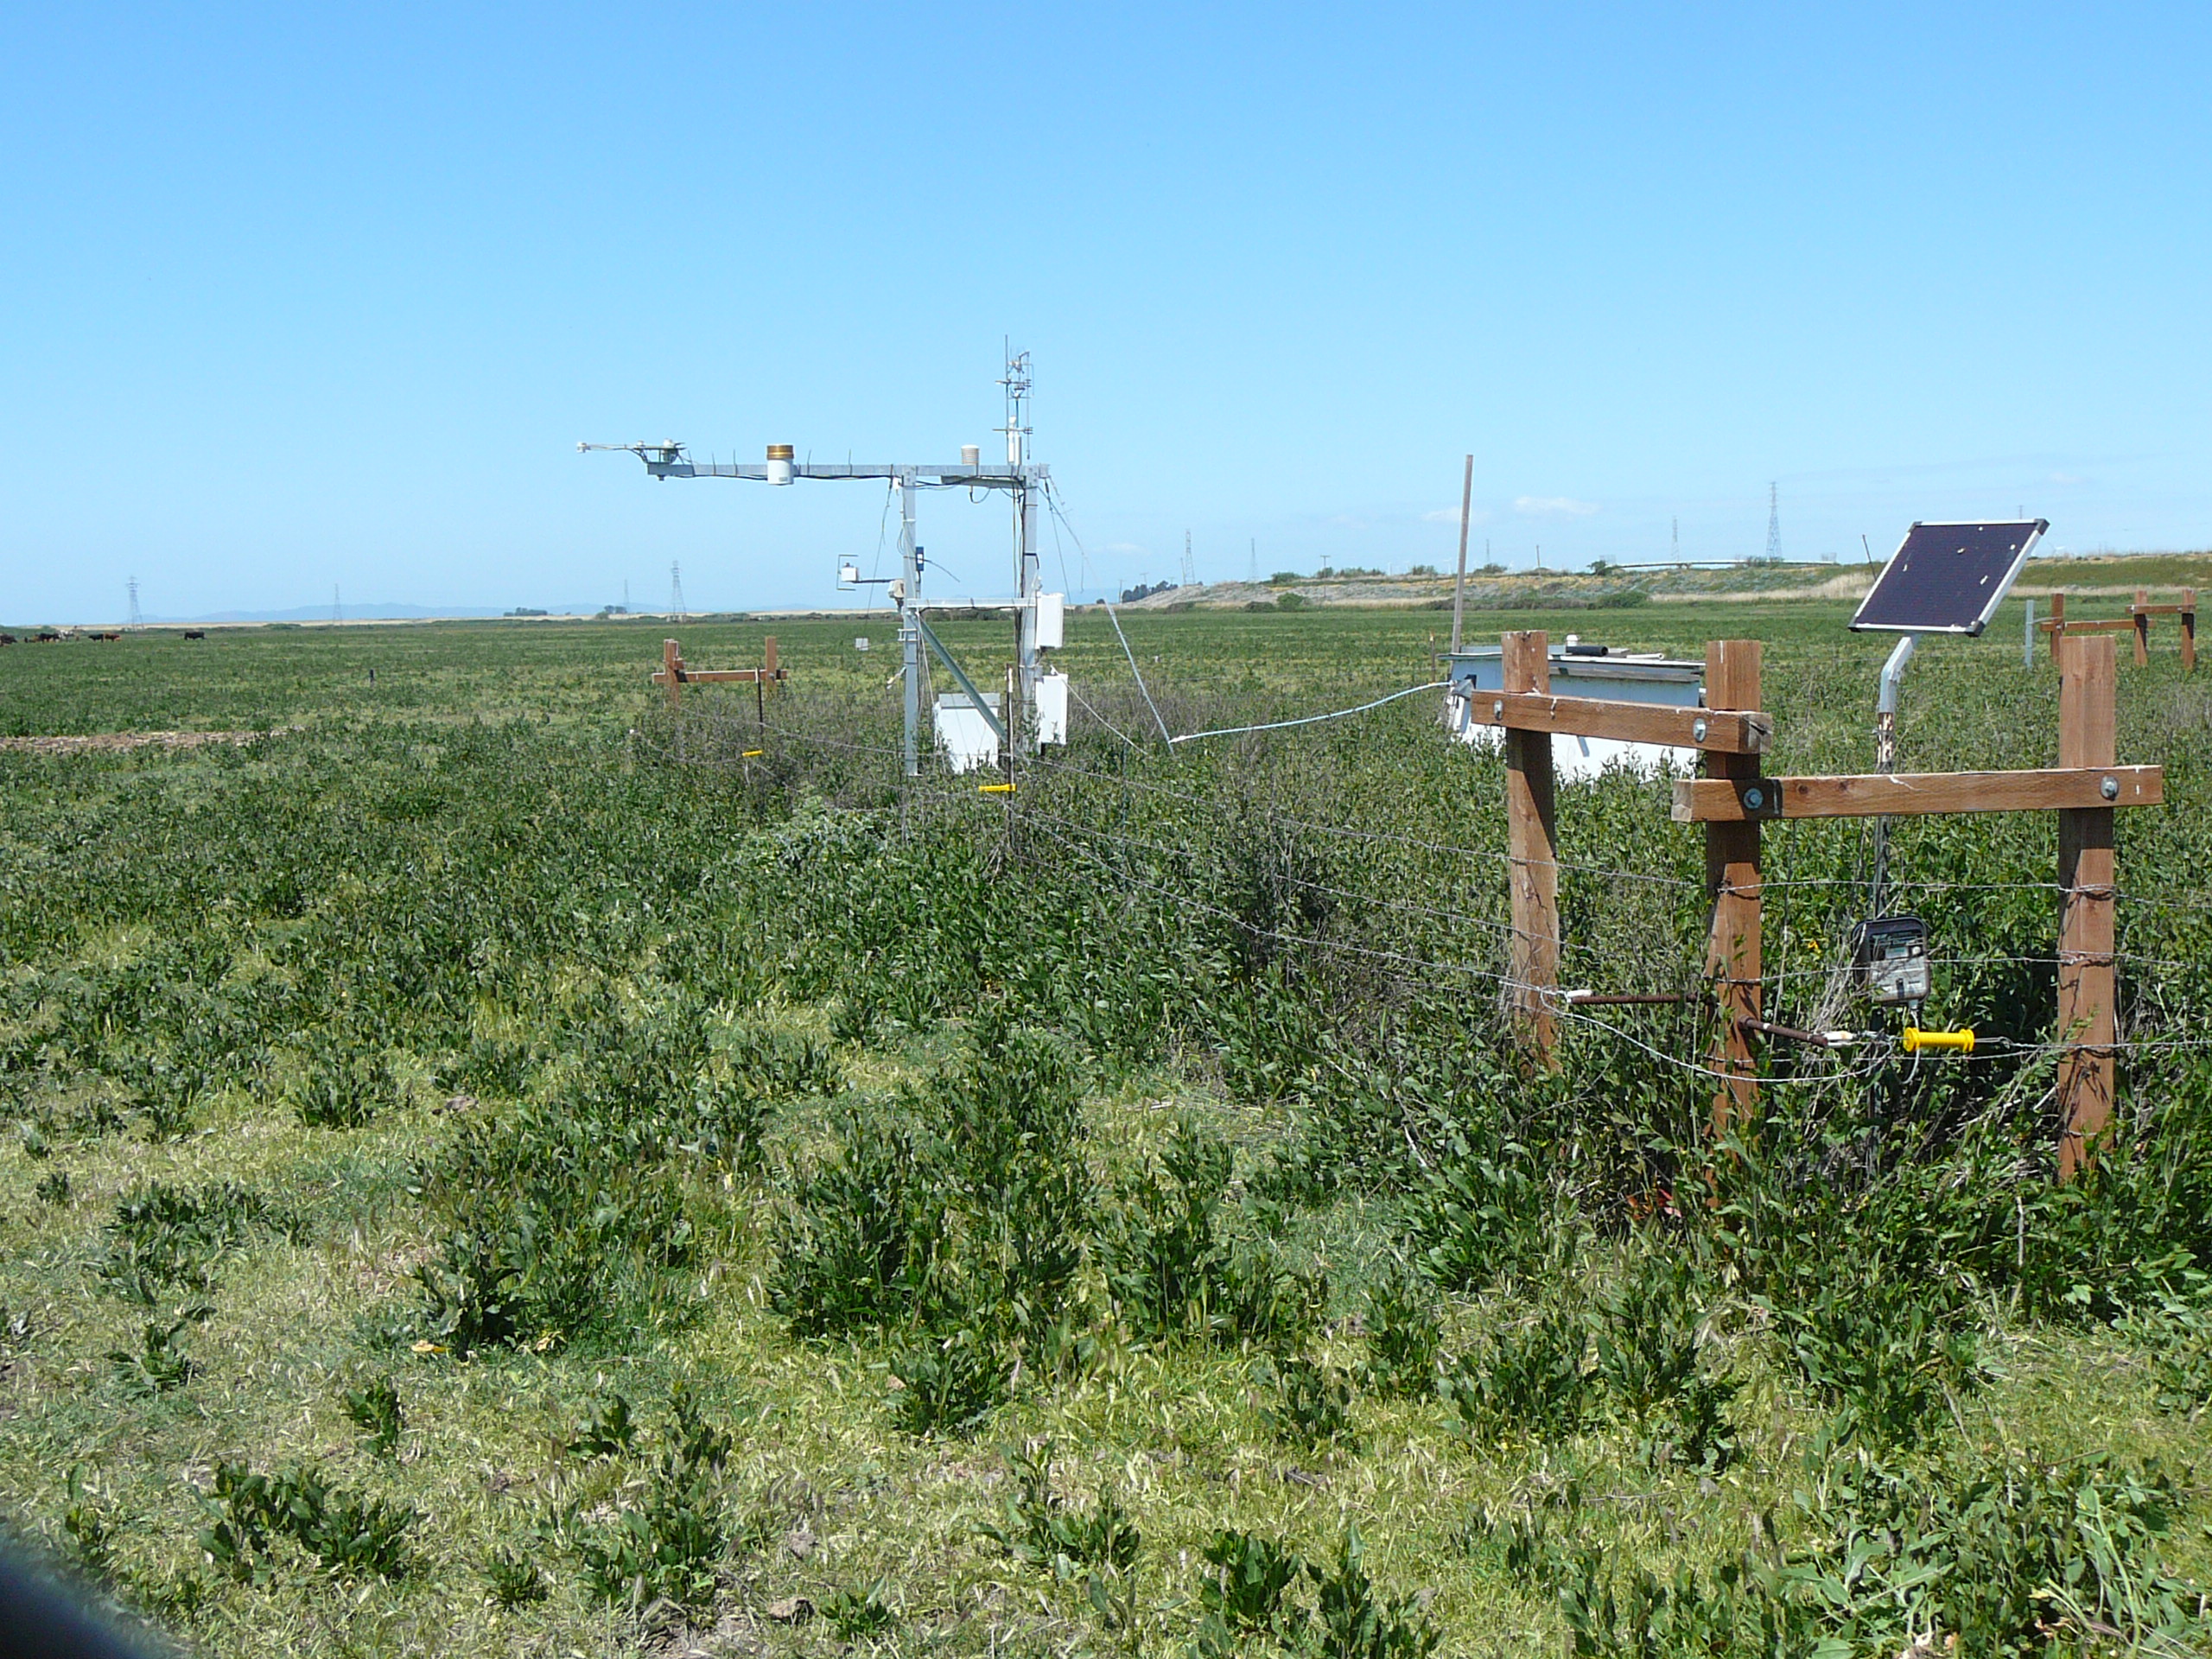
20110426SI_Site.jpg ( 2011-04-26 11:01:56 ) Full size: 2560x1920
Cow fence and tower at Sherman
7 sets found
1 SI_mp graphs found
11 SI_met graphs found
Can't check SI_mixed
2 SI_mixed graphs found
5 SI_flx graphs found
2 SI_soilco2 graphs found
Can't check TWSI_mixed
Can't check SIMBTWEE_met