Field Notes
<--2011-01-28 12:00:00 | 2011-03-01 10:30:00-->Other sites visited today: Mayberry | Twitchell Rice
Phenocam link: Searching...
Sherman Island: 2011-02-08 09:30:00 (DOY 39)
Author: Joe Verfaillie
Others: Jaclyn, Dennis, Naama
Summary: Super windy, Li7500 swapped.
| Sherman
2/8/2011 I arrived about 9:30am with Jaclyn, Dennis and Naama. It was blowing like crazy from the northwest. Average wind speed was around 12m/s and gusts to 20m/s. The sky was clear and sunny. Cows were in the area near the tower. The ground is relatively dry but wetter in the west end of the field. Tower systems were okay. I had to restart the computer as it locked up just as I started working with it. I left the CD tray ejected as it seemed to hang up looking for CD on reboot. I swapped the LI7500 – sn 0073 went on and sn 0418 came off. Dennis cleaned the radiometers and tipping bucket. Jaclyn did fieldwork. The CNR1 PRT is still bad. The Soil CO2 23x is still acting funny. |
4 photos found

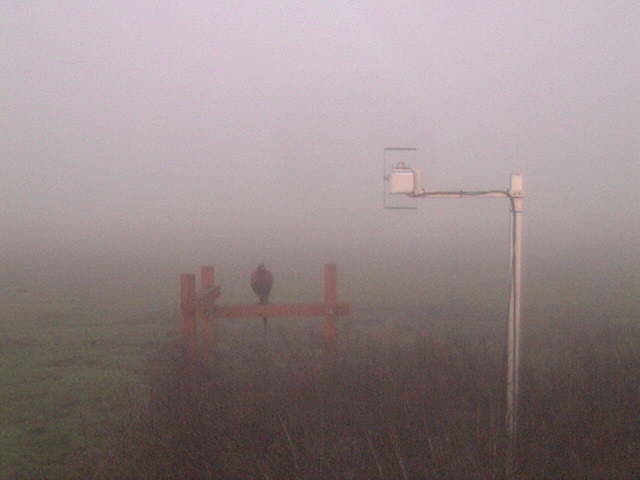
SI_webcam_2011038_0815.jpg ( 2011-02-07 08:15:02 ) Full size: 640x480
Pheasant in the deep fog.

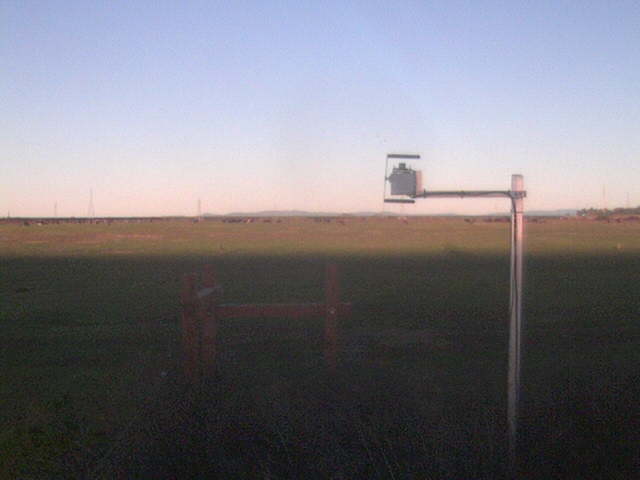
SI_webcam_2011039_0745.jpg ( 2011-02-08 07:45:02 ) Full size: 640x480
Bridge shadows approaching the site.

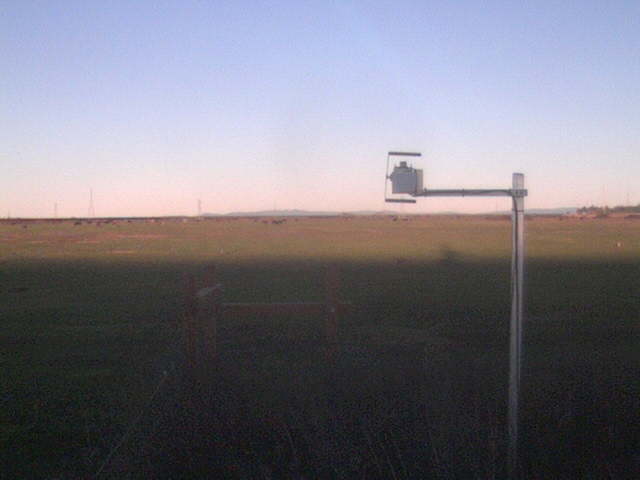
SI_webcam_20110400745.jpg ( 2011-02-09 07:45:02 ) Full size: 640x480
Bridge shadow

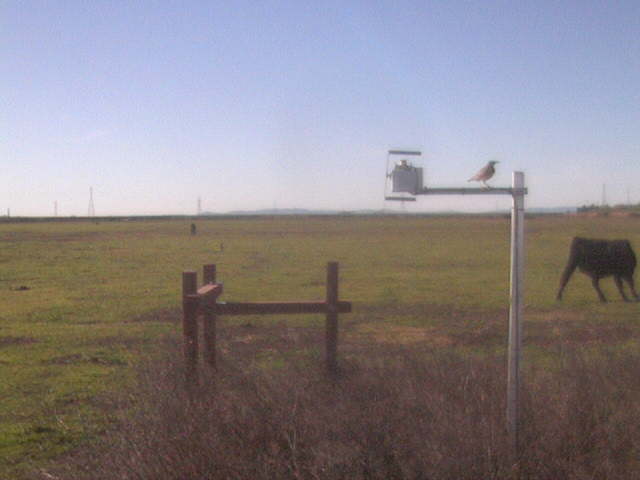
SI_webcam_20110401445.jpg ( 2011-02-09 14:45:02 ) Full size: 640x480
Bird on diffuse PAR boom
7 sets found
No data found for SI_mp.
11 SI_met graphs found
Can't check SI_mixed
2 SI_mixed graphs found
5 SI_flx graphs found
2 SI_soilco2 graphs found
Can't check TWSI_mixed
Can't check SIMBTWEE_met

