Field Notes
<--2025-01-17 11:00:00 | 2025-02-07 17:00:00-->Other sites visited today: Mayberry | East End
Phenocam link: Searching...
Gilbert Tract: 2025-01-29 10:10:00 (DOY 29)
Author: Robert Shortt
Others: Daphne
Summary: Regular data collection, downloaded data from water sensors + mini CH4, tried to add DCP-sonde adapter to EXO--more work needed
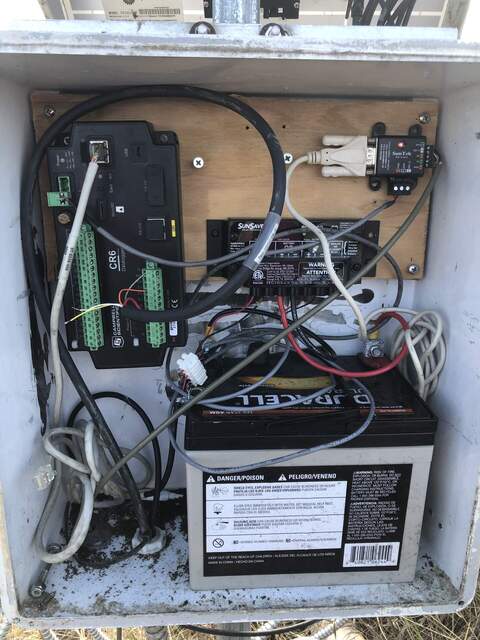
| Daphne and I arrived at 10:10am, the weather was sunny & mild, with clouds on the horizon. There was lots of cattail fluff around. We saw some people from River Partners doing some work over by our usual parking spot, there was also a new wooden stake labeled "camera post". They saw our solar setup and were curious where we got our batteries from. The one they bought from Amazon did not power their little motorboat for long. Daphne trained me on the field data download protocol. All data appeared normal. The camera card did not mount normally at first, but after reformatting it was able to communicate. The MiniDOT with the float attached (899502) had gotten flipped up so it was measuring air instead of water. We shortened the chain slightly and replaced it in its correct orientation. We collected data from both the floating and usual miniDOT and swapped its desiccants. We downloaded the data from the MiniCH4, but forgot to wipe the old data. The clock looked food and Daphne restarted logging with the next sample at 11:45 (download time was 11:23). We swapped the miniCH4 battery pack: sn 38-571-35 came off and sn 38-569-35 went on. I put the miniCH4 back on its chain on the south side of the boardwalk. Joe had originally floated the miniCH4 off the western end of the boardwalk near the fence post with the water sensors, but Daphne though that there the float might drag at the sensor cables going to the fence post. I downloaded the Song Meter Micro app, downloaded the Song Meter Micro data and changed its desiccant. The battery was at 100% and the clock looked good. The flux and rad sensors were cleaned. The 7500 had a big condensation puddle on the top lens. 7500 read: 436ppm CO2, 560mmol/m3 H2O, 14.1C, 102.2kPa, 36SS —99 after cleaning 7700 read: 2.1ppm CH4, 62RSSI – 85 after cleaning The staff gauge read 48cm at 11:07 PST. We measured the surface water conductivity. Surface, 348uS, 6.1C We arrived at the channel at 11:43am, we downloaded the Exo & ADCP data. There was a CDFW truck parked at the channel. We re-organized some components inside the logger box to make space for the EXO DCP-sonde adapter. I also rotated the ADCP adapter to prevent condensation from the enclosure ceiling dripping into the ADCP power port. Daphne moved the EXO from the CR6 to the DCP adapter and connected the adapter to the CR6 via SDI-12, but she didn't see any data coming into the CR6. She changed the SDI-12 call in the CR6 program from C! to M! (that's what we use at HS on a CR23X), but the depth/psi (2nd and 3rd columns) did not read correctly, even after a power cycle. After some more troubleshooting, she moved the EXO back to the CR6 and confirmed the data looked reasonable. The EXO takes about a minute to respond after the SDI-12 call, so it's possible we just didn't wait long enough when testing the DCP-sonde adapter. Try again next time, and bring a miniUSB cable, too, to actually talk with the EXO and check its sensors' QA/QC scores. We left at 12:55pm. |
1 photos found

20250129GT_ChannelEnclosure.jpg ( 2025-01-29 12:52:26 ) Full size: 1440x1920
Reorganized the GT channel enclosure. Rotated the ADCP interface to prevent condensation from the ceiling dripping down into the power plug. Also made space in the middle for the EXO DCP signal output adapter.
8 sets found
Can't check MBWPEESWGT_mixed
Can't check MBEEWPSWEPGT_cam
16 GT_met graphs found
4 GT_flux graphs found
3 GT_adcp graphs found
1 GT_cam graphs found
2 GT_usgs graphs found
2 GT_chanexo graphs found

