Field Notes
<--2024-10-09 13:45:00 | 2024-11-06 11:10:00-->Other sites visited today: Gilbert Tract | Mayberry | Bouldin Alfalfa | East End
Phenocam link: Searching...
Bouldin Corn: 2024-10-23 13:00:00 (DOY 297)
Author: Daphne Szutu
Others: Kuno
Summary: Sorghum has been harvested, swapped 7500 for calibration
| 2024-10-23 Bouldin Corn Kuno and I arrived at 13:00 PST. It was sunny and mild with a breeze; we could see numerous dust devils while driving around. The sorghum has been harvested. There’s stover remaining in the majority of the field and the sides of the field is covered with flattened litter, like someone drove over it. Most of Charlotte’s chamber seem to be in the flattened area. I downloaded met, cam, USB GHG, and PA data. The wash reservoir was 1/3 empty; Kuno refilled it. I swapped the lithium power pack: 2/4 LEDs on the old pack and 4/4 LEDs on the new pack. Kuno cleaned flux and rad sensors and we swapped the 7500 for calibration: sn 0035 came off and sn 0041 went on. I uploaded a new config file, updated the pressure coefficients, and reset the box. All looked ok. old 0035 read: 394pm CO2, 707mmol/m3 H2O, 28.2C, 101.8kPa, 86SS – high CO2 and low SS clean 0035 read: 432pm CO2, 430mmol/m3 H2O, 28.2C, 101.8kPa, 98SS fresh 0041 read: 434ppm CO2, 411mmol/m3 H2O, 27.8C, 101.9kPa, 97.5SS 7700 read: 2.0ppm CH4, 35RSSI – 79 after cleaning We left at 13:25 PST. |
2 photos found

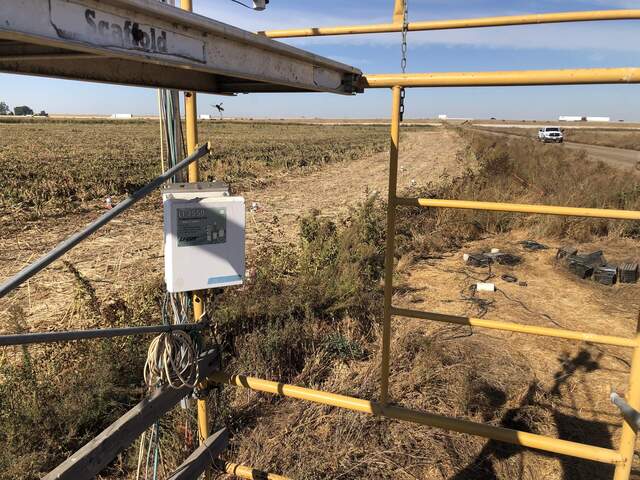
20241023BC_FlatStover.jpg ( 2024-10-23 14:23:00 ) Full size: 1920x1440
Stover around edges of field were flattened. Charlotte's chambers mostly installed in the flattened area.

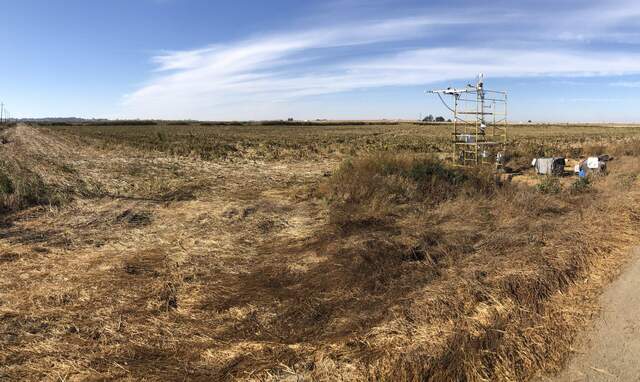
20241023BC_PostHarvest.jpg ( 2024-10-23 14:23:56 ) Full size: 1920x1145
Stover remaining after sorghum was harvested
6 sets found
17 BC_met graphs found
5 BC_flux graphs found
Can't check TATWBABCSB_cam
Can't check MBSWEEWPBCBA
2 BC_pa graphs found
1 BC_arable graphs found

