Field Notes
<--2024-08-07 12:40:00 | 2024-08-29 11:40:00-->Other sites visited today: Mayberry | Bouldin Corn | Bouldin Alfalfa | Hill Slough
Phenocam link: Searching...
East End: 2024-08-15 12:00:00 (DOY 228)
Author: Joe Verfaillie
Others: Daphne
Summary: Brought scaffolding from West pond to raise towers. Need new RH/T, need to move/check water level sensor, Moved data logger box to short side of tower.
| East End 2024-08-15 Daphne and I arrived at about 12:00 PST. It was warm and waspy with only a light breeze above the canopy. We stopped at West Pond before to pick up some of the spare scaffolding there. We grabbed one set of full frames, one set of half frames, two boardwalks, and four cross braces. One full frame had wasps coming and going from a hole - we left that frame at WP and locked it up with the remaining full frames. We strapped the pair of full frames on the minivan's roof rack and everything else went in the van. We had to go through one goat fence to get to East End but didn't see any sheep or goats except for one lone goat panting in the shade near the well pad. At the site the water level was 70cm and Daphne collected data since she will be away next week. The 7500 read: 412ppm CO2, 678mmol/m3 H2O, 29.8C, 101.4kPa, 97.7SS - 98.0 after cleaning The 7700 read: 2.05ppm CH4, 54RSSI - 70+ after cleaning. The wash reservoir was 90% full - refilled. The HMP60 is finally dying - swap out next time. The water level sensor has a lot of gaps. We can move it when we do the rewiring (see below) and maybe add a sonic range finder. We made preparations for raising the tower and the solar panels which have both been encroached upon by taller and taller reeds. I think we will swap out a half set of frames at the solar panels for a full set of frames (~2.5ft 76cm rise). And we will add a half set of frames directly under the railing at the top of the tower - same rise as the solar panels. This will require some rewiring because the ground sensors and the tower top sensors will spread further apart and neither set has enough slack to move. The plan is to add a new box at the top of the second set of frames and move the C1000 and AM16/32 there. The AM25T and conductivity interface will stay in the original box at the top of the bottom set of frames. To prepare for this we moved the current box to a 2x4 on the short side of the scaffolding (south side) and moved the 2x4 it was currently mounted on up to the top of the second set of frames. This box is due for wiring clean up anyway - new power strip. I lugged one set of full frames out to the solar panels and stacked them there. I cut reeds around the solar panels. The bottom set of frames here seem in bad shape too. We might need to rebuild that scaffolding entirely. I attached one 10ft pipe to the tower scaffolding with crossover clamps. My idea is to use four vertical pipes to incrementally raise the railings at the top of the tower until we can slip in the half frame set underneath the railings. We left a second pipe and crossover fittings but two other pipes and fitting were used at Mayberry to shore up the scaffolding there. The other set of half frames, two boardwalks and four cross braces along with the new data logger box were all left on the boardwalk for next time. We left at about 13:10 PST for Bouldin |
1 photos found

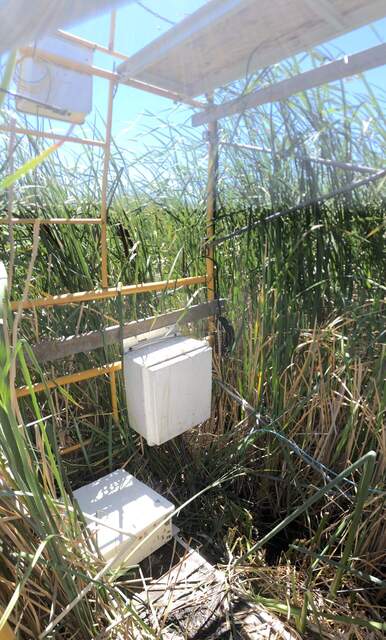
20240815EE_Box.jpg ( 2024-08-15 14:15:28 ) Full size: 1158x1920
Temporarily moved met box to short side of scaffolding to make space for adding additional half layer to raise height of eddy/rad sensors
11 sets found
14 EE_met graphs found
Can't check EE_mixed
1 EE_mixed graphs found
8 EE_flux graphs found
Can't check MBWPEESWGT_mixed
1 EE_cam graphs found
Can't check MBEEWPSWEPGT_cam
Can't check SIMBTWEE_met
Can't check EE_Temp
5 EE_Temp graphs found
Can't check EE_minidot
1 EE_minidot graphs found
Can't check MBSWEEWPBCBA
1 EE_processed graphs found

