Field Notes
<--2024-07-23 08:15:00 | 2024-08-15 12:00:00-->Other sites visited today: Hill Slough | Bouldin Corn | Bouldin Alfalfa | Mayberry | Gilbert Tract
Phenocam link: Searching...
East End: 2024-08-07 12:40:00 (DOY 220)
Author: Daphne Szutu
Others: Joe, Kuno
Summary: Biomet Olympics tipping bucket relay, 7700 calibrated, rain bucket moved, Picam power issues - fixed, maybe
| 2024-08-07 East End Joe, Kuno, and I arrived at 12:40 PST. It was hot and there were lots of wasps buzzing around the tower. It was still and humid within the canopy (on the lower level of the tower), although I heard there was a bit of breeze on the upper level. We saw that Mel had attached one of her bird recorders to the upper layer of scaffolding here. Joe and Kuno did the tipping bucket relay at East End in the 2024 Biomet Olympics. Here Joe led off with a spectacular tipping bucket dismount on the boardwalk railing before passing it to Kuno at the top of the tower. Kuno expertly dodge the wasps and reattached the bucket to the northeast corner of the scaffolding in record time. The staff gauge read 78cm. Kuno cleaned flux and rad sensors. I downloaded met, cam, USB GHG, and miniDOT data. I did not change the miniDOT desiccant because we didn't have any more dry minipaks. The wash reservoir was full. I was having trouble download from picam sn RPI0W-006. This is the one we moved from WP and installed under the 7500. It could connect and load the website, but the download would fail right away. Then the website would not load anymore. Seemed like a power issue. I power cycled it but that didn't change anything. Joe tightened the screw terminal inside the picam enclosure, which solved the issue. This picam's DC-DC converter is in the main met box. We can move it to the picam's enclosure next time. We calibrated the 7700. The offsets were small and we replaced the hat and spray nozzle after the calibration. I checked that the 7700 was connected and that the USB was logging after the calibration. Joe moved the precip bucket from the boardwalk to the northeast corner of scaffolding. We are getting ready to raise the tower because the reeds are getting tall. Cattails are running into the bottom of the radiometer boom, and an especially tall tule had actually grown between the rotating shadow band and the dfPAR enclosure, so that the shadow band was caught on the tule and was not turning. Joe trimmed the tule and tightened the band. He said we can plan to raise the tower by a half-level and raise the solar panels by a full level. The solar panels will be annoying because we'll also have to move the batteries up. I measured the surface water conductivity. Sample, temperature-compensated conductivity, temperature Surface, 228.8 uS, 21.0 C The 7500 read: 423ppm CO2, 668mol/m3 H2O, 35.7C, 101.1kPa, 96.7SS – 97 after cleaning The 7700 read: 2.24ppm CH4, 41RSSI – 70 after cleaning The 7700 calibrated read: 2.21ppm CH4, 69RSSI We left at 13:25 PST. We drove north and then west from EE to check on the scaffolding at WP. The road is overgrown with several trees leaning over that Joe had to get out and prop up so I could drive by without too much obstruction. The scaffolding is still there and locked up. Joe gave it a kick and saw a few wasps buzzing. |
2 photos found

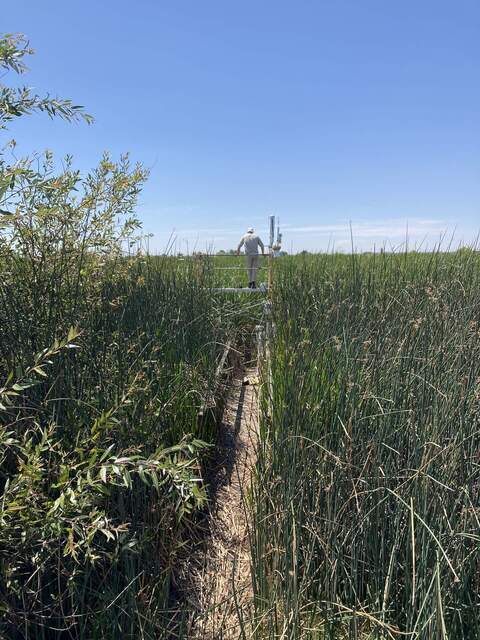
20240807EE_KunoTowerTop.jpg ( 2024-08-07 14:04:13 ) Full size: 1440x1920
Kuno on top of the East End tower

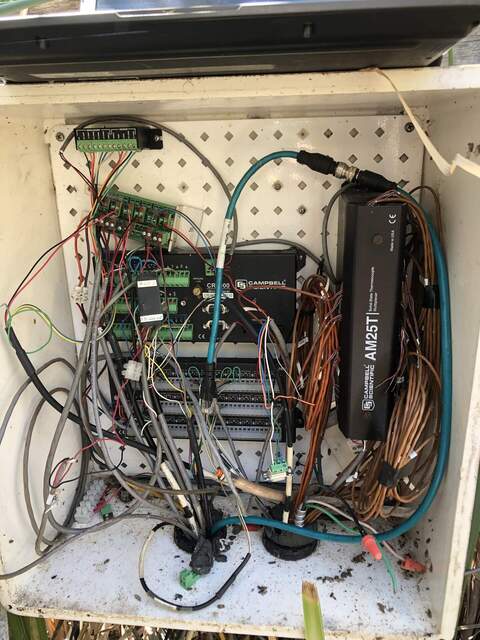
20240807EE_MetBox.jpg ( 2024-08-07 14:22:29 ) Full size: 1440x1920
Inside of met box. This will need to be reorganized when we increase the scaffolding height.
11 sets found
14 EE_met graphs found
Can't check EE_mixed
1 EE_mixed graphs found
8 EE_flux graphs found
Can't check MBWPEESWGT_mixed
1 EE_cam graphs found
Can't check MBEEWPSWEPGT_cam
Can't check SIMBTWEE_met
Can't check EE_Temp
5 EE_Temp graphs found
Can't check EE_minidot
1 EE_minidot graphs found
Can't check MBSWEEWPBCBA
1 EE_processed graphs found

