Field Notes
<--2024-07-17 11:20:00 | 2024-08-07 12:40:00-->Other sites visited today: Gilbert Tract | Hill Slough
Phenocam link: Searching...
East End: 2024-07-23 08:15:00 (DOY 205)
Author: Daphne Szutu
Others: Irene
Summary: Hot day, cattails touching rad boom, swapped 7500 for calibration, tree down on the interior levee road
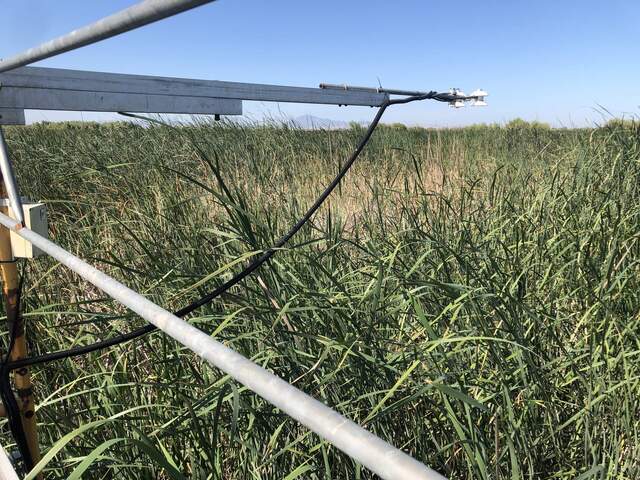
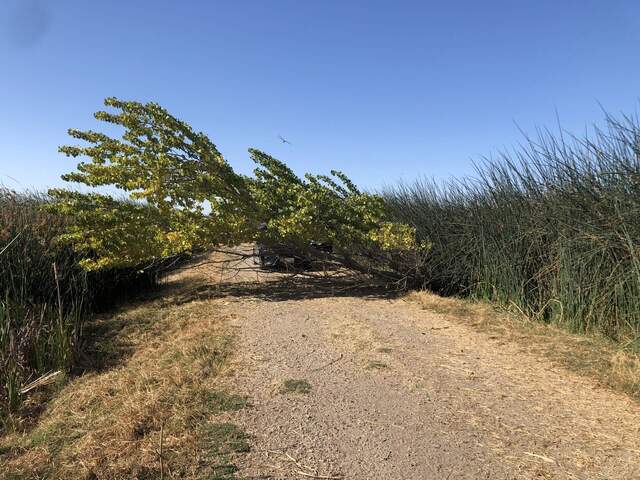
| 2024-07-23 East End Irene and I arrived at 8:15 PST (9:15 PDT). It was sunny, warm, and still. The goats (and their guardian dog) are still hanging out by the well pad. One of the levee trees (cottonwood?) was laying across the road, just south of the tower. We parked by the tree and walked the remaining 10m to the tower boardwalk. I’ll e-mail David Julian about the tree. Some of the cattails are almost touching the radiometer boom. A few are directly in front of the old picam. Joe suggested we add another half layer to the tower given our surplus scaffolding stashed at West Pond. The staff gauge read 77cm. I downloaded met, cam, and USB GHG data. Irene cleaned flux and rad sensors. We swapped the LI-7500A for calibration: sn 75H-2669 came off and sn 75H-2514 went on. I uploaded a new configuration file, updated the pressure coefficients, and changed the eddy clock -4min from 8:34 to 8:30 PST to match the laptop time. I reset the 7550 box and confirmed all looked ok. old 75H-2669 read: 420pm CO2, 930mmol/m3 H2O, 29.1C, 100.9kPa, 76SS fresh 75H-2514 read: 438ppm CO2, 750mmol/m3 H2O, 29.6C, 100.9kPa, 97SS 7700 read: 2.34ppm CH4, 36RSSI – 72 after cleaning We left at 8:42 PST (9:42 PDT). Since today was Irene’s first time at East End, we stopped at the scenic viewpoint on the levee above the pumphouse. |
2 photos found

20240723EE_TallCattails.jpg ( 2024-07-23 09:40:01 ) Full size: 1920x1440
Tall cattails are starting to brush the bottom of the radiometer boom

20240723EE_TreeDown.jpg ( 2024-07-23 09:15:29 ) Full size: 1920x1440
Tree down on the interior levee road, just south of our tower
11 sets found
14 EE_met graphs found
Can't check EE_mixed
1 EE_mixed graphs found
8 EE_flux graphs found
Can't check MBWPEESWGT_mixed
1 EE_cam graphs found
Can't check MBEEWPSWEPGT_cam
Can't check SIMBTWEE_met
Can't check EE_Temp
5 EE_Temp graphs found
Can't check EE_minidot
1 EE_minidot graphs found
Can't check MBSWEEWPBCBA
1 EE_processed graphs found

