Field Notes
<--2024-07-22 11:25:00 | 2024-08-15 13:45:00-->Other sites visited today: Hill Slough | Bouldin Alfalfa | East End | Mayberry | Gilbert Tract
Phenocam link: Searching...
Bouldin Corn: 2024-08-07 10:40:00 (DOY 220)
Author: Daphne Szutu
Others: Joe, Kuno
Summary: Biomet Olympics synchronized sorghum diving, 7700 calibration, biomass samples, cleaned zcams, LIA-2200 measurements
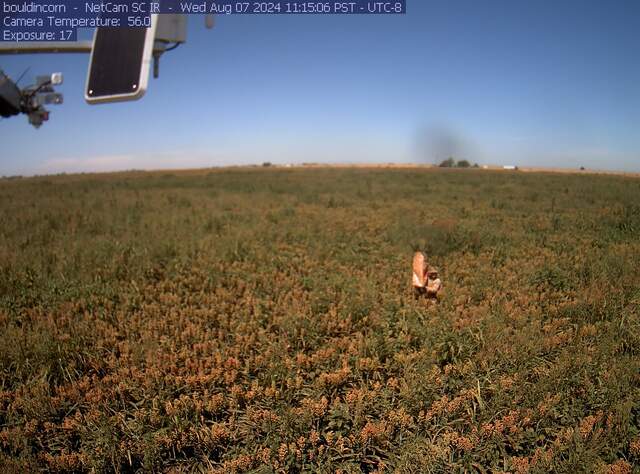
| 2024-08-07 Bouldin Corn Joe, Kuno, and I arrived at 10:40 PST. It was hot and still. The sorghum plants look pretty similar as our last visit. There were a lot of wasps buzzing about. We didn't see any obvious nests except for a medium-sized one under the lower boardwalk, which I sprayed off at the end before we left. The Bouldin Sorghum venue hosted the second event in the 2024 Biomet Olympic hexathalon. Here Daphne and Joe competed in synchronized sorghum diving. Unfortunately they were not well synchronized and Joe made a lot of splash entering the sorghum. I collected met, cam, USB GHG, and PA data. Kuno cleaned flux and rad sensors. I downloaded the zcams and noted that their lenses were dirty again. The zcams are still taking daytime photos only, even though I un-checked the "Nighttime photos only" box. I confirmed that the box is still unchecked. We calibrated the 7700. The offsets were small and we replaced the hat and spray nozzle after the calibration. I checked that the 7700 was connected and that the USB was logging after the calibration. Joe collected sorghum biomass samples: 3 bags of sorghum and 1 bag of weeds. The row are cross planted at the edge of the field but further in there are distinct rows about 80cm apart. But the spacing along the row is not as neat as corn. Joe took all plants from a 50cm length of the row. Weeds come up mainly between rows or gaps in a row. We have to decide the ratio of sorghum to weeds in the field. The sorghum leaves gooey with exodate and have more detritus on them than the corn plants. We decided not to scan the leaves on the LI-3100C, just to do the dry weight biomass. I set up the LI-2200C wand for LAI. I set up the "above" wand on the road. I used the 'below" wand to do a 4A scattering file, then Joe took the "below" wand into the field for the below measurements. Our Quick LAI was about 5.6. This LAI does not include scattering correction (which should be small) and uses "A" measurements taken with the "below" wand immediately going into the canopy. In post-processing I can match up the "A" measurements from the "above" wand with the "B" measurements from the "below" wand using time. The sky was clear so this should only make a tiny difference. Notes on the 6 LAI locations - two readings on row two readings between rows at each location. 1. Few weeds 2. Medium weeds 3. Heavy weeds 4. No weeds 5. No weeds 6. Heavy weeds I found the zcams and cleaned their lenses. They were gritty and a bit sticky. I tried not to disturb the canopy directly above the cameras. 7500 read: 408ppm CO2, 695mmol/m3 H2O, 32.2C, 101.3kPa, 96SS - 98 after cleaning 7700 read: 2.03ppm CH4, 50RSSI - 75 after cleaning 7700 calibrated read: 2.02ppm CH4, 73RSSI We left at 11:40 PST. |
1 photos found

bouldincorn_2024_08_07_111506.jpg ( 2024-08-07 19:17:24 ) Full size: 1296x960
Joe doing clip plots in the sorghum
6 sets found
17 BC_met graphs found
5 BC_flux graphs found
Can't check TATWBABCSB_cam
Can't check MBSWEEWPBCBA
2 BC_pa graphs found
1 BC_arable graphs found

