
Field Notes
<--2024-07-16 14:00:00 | 2024-08-07 08:40:00-->Other sites visited today: East End | Gilbert Tract
Phenocam link: Searching...
Hill Slough: 2024-07-23 11:00:00 (DOY 205)
Author: Daphne Szutu
Others: Irene
Summary: Hot day, low tide, re-did GPS for HSM_2 and HSM_7, deployed freshly calibrated EXO, raised height of all channel sensors
| 2024-07-23 Hill Slough Irene and I arrived at 11:00 PST (12:00 PDT). It was sunny, hot, and breezy. There were 3 sketchy cars parked by the gate. Two pickup trucks (with no one in them) and a white cargo van that had its back windows covered. We took our backpacks with us and made sure to lock the boardwalk behind us. It was near low tide and spring tide was yesterday, so the water level was similar or even lower to our recent soil sampling dates (at the end of June). Irene and I put on waders and re-did the GPS points for HSM_2 and HSM_7. For the GPS measurements, the Archeological Research Facility rented us the Trimble Geo7x, instead of the Trimble GeoXH 6000 which we used previously. We walked easily from the tower to HSM_2. We then took three point measurements with the GPS. From HSM_2, we moved to HSM_7 and it was difficult to move through the mud, which in some moments got to our knees. There, we took three measurements as well, and walked back to the tower. We did not manage to get to 1m of accuracy in either of the sites and our measurements were around 4 m of accuracy. I started the tower servicing around 12:00 PST while Irene took three point measurements next to each thermocouple profile. These points are named in the GPS file as tc1, tc2, and tc3. Tc1 is the furthest from the tower, tc2 is the one closest to the channel, and tc3 is the one closest to the tower. For these measurements, accuracy was worse than 4m (around 5m). We didn’t feel too hot while in the waders, but both of our pants were totally soaked with sweat when we removed our waders. I guess the warm, dry breeze kept us cool enough. I downloaded met, cam, and USB GHG data. I swapped the 7700 thermocouple since it broke a few weeks ago. The water level was below both of our staff gauges, so no staff gauge reading today. Only the top ~20cm of the channel staff gauge is above the mud, so all I can say is that the water level was below ~3.5ft. 7550 read: 423ppm CO2, 739mmol/m3 H2O, 34.9C, 101.2kPa, 100SS 7700 read: 0.076 mmol/m3 CH4 --> 1.9ppm CH4 after swapping 7700 thermocouple, 41RSSI – 81 after cleaning I measured the porewater conductivity. There was not enough surface water (even in the channel) to measure conductivity. Sample, Temperature-compensated conductivity, Temperature Porewater, 7.46mS, 33.1C I deployed the EXO in the channel with a brand-new fDOM sensor and a freshly swapped pH/ORP module. Sensors added: sn 22C103416 EXO2 sn 22E106072 Turbidity sn 24F104438 fDOM sn 23D104030 Conductivity/Temperature sn 22D102641 pH/ORP I checked the numbers at the CR1000 and everything seemed reasonable. We raised the height of all of the channel sensors since they are still in the mud right now at low tide. I raised the EXO about 15 cm. I raised the CTD, eosGP, and miniDOT about 10cm. We left at 13:00 PST (14:00 PDT). The two sketchy pickup trucks had disappeared but the van was still there. No one bothered us. Our car said it was 41C (107F) while we were driving away. |
5 photos found
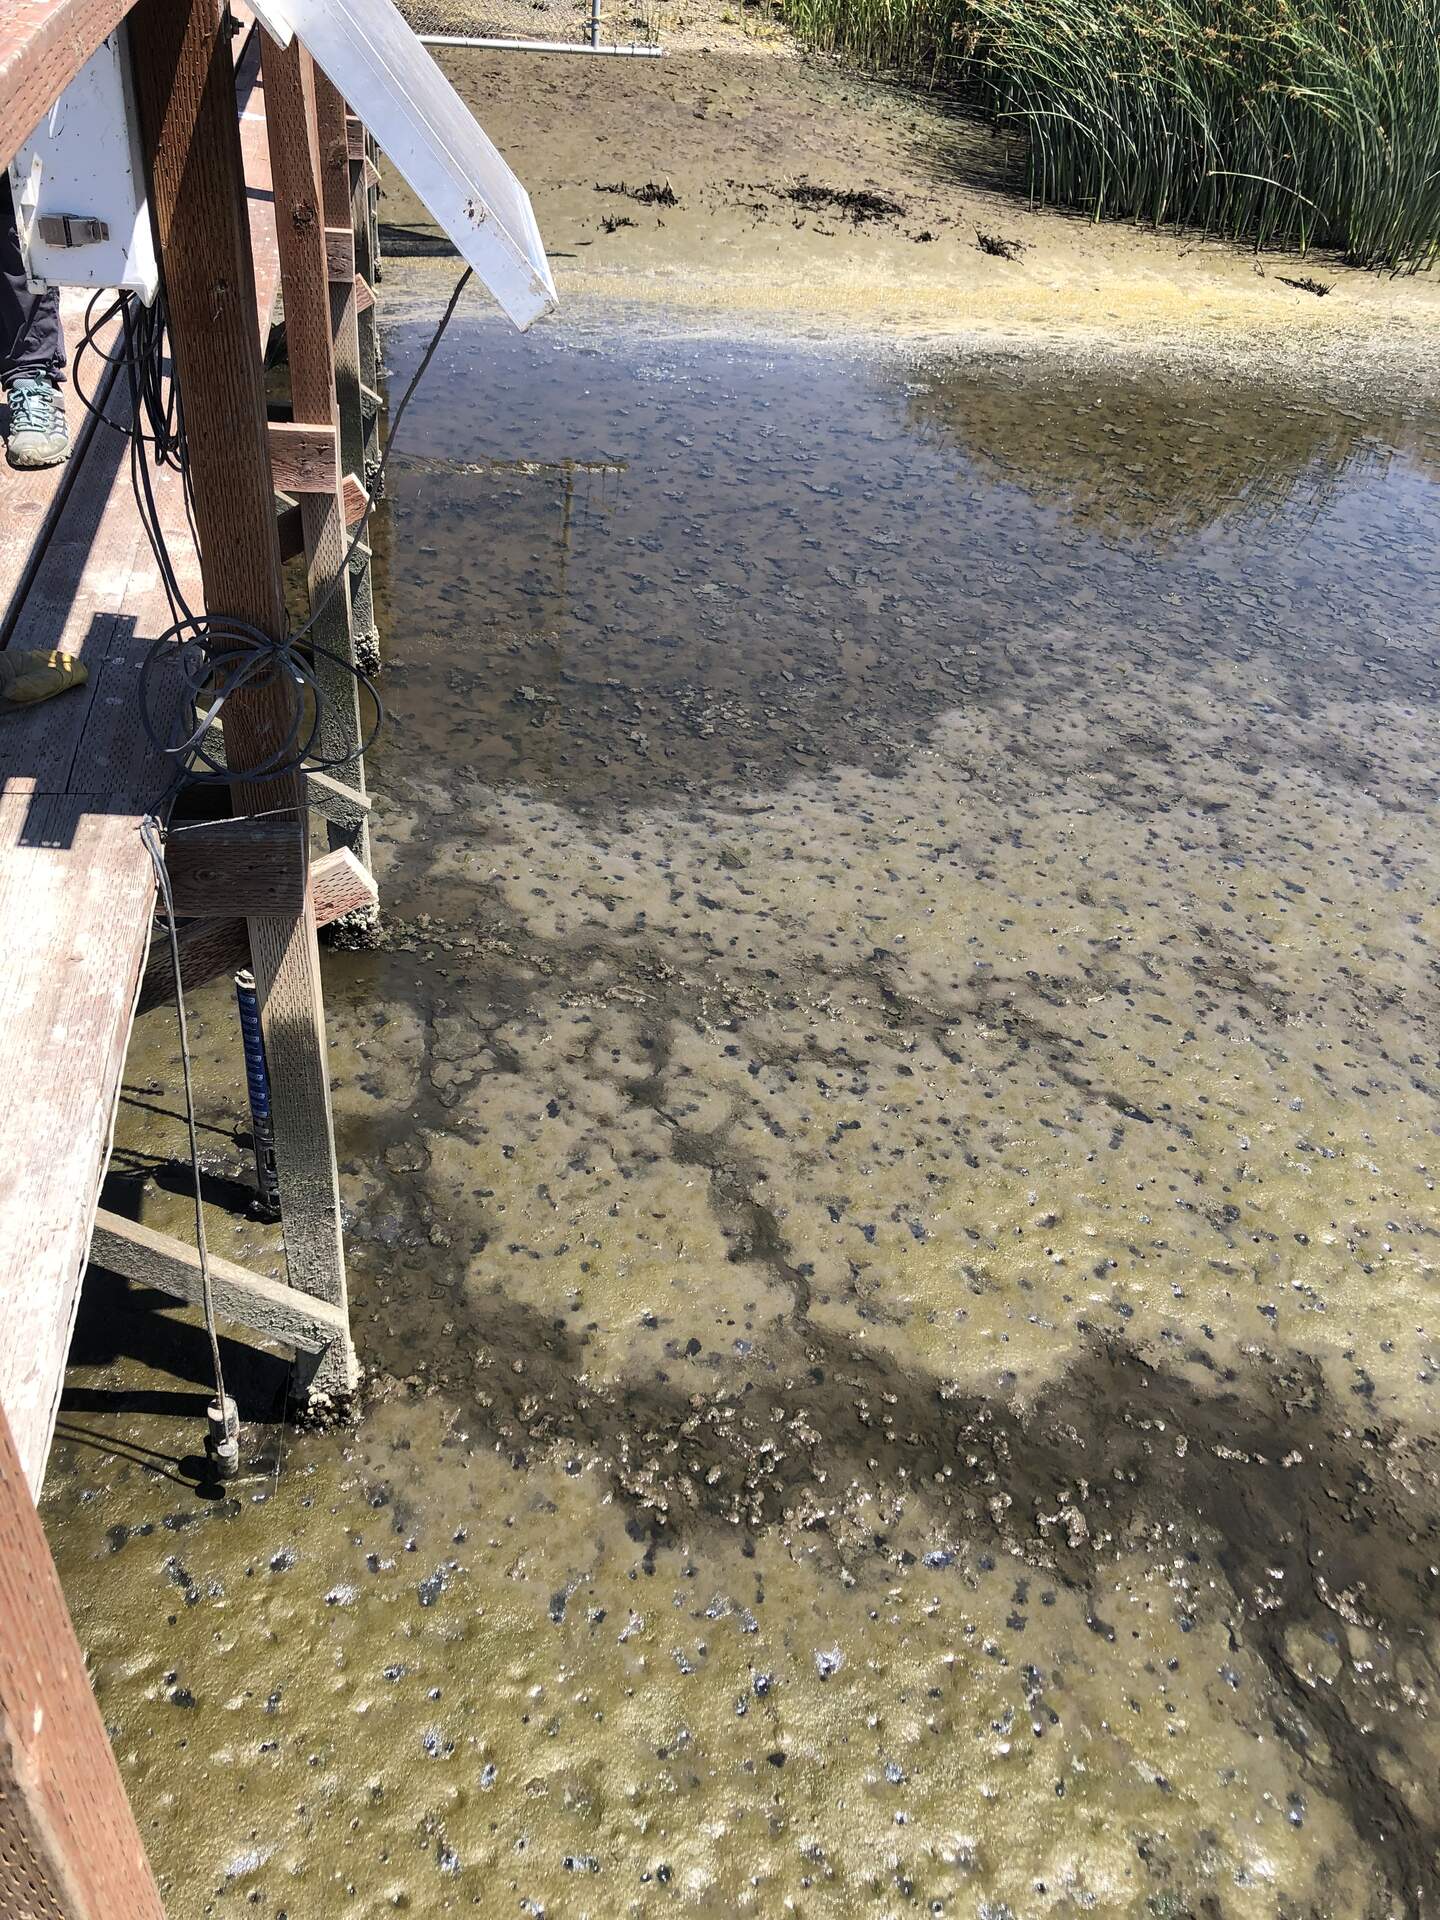
20240723HS_ChannelLowTide.jpg ( 2024-07-23 13:57:23 ) Full size: 1440x1920
At spring low tide, there is almost no surface water in the channel
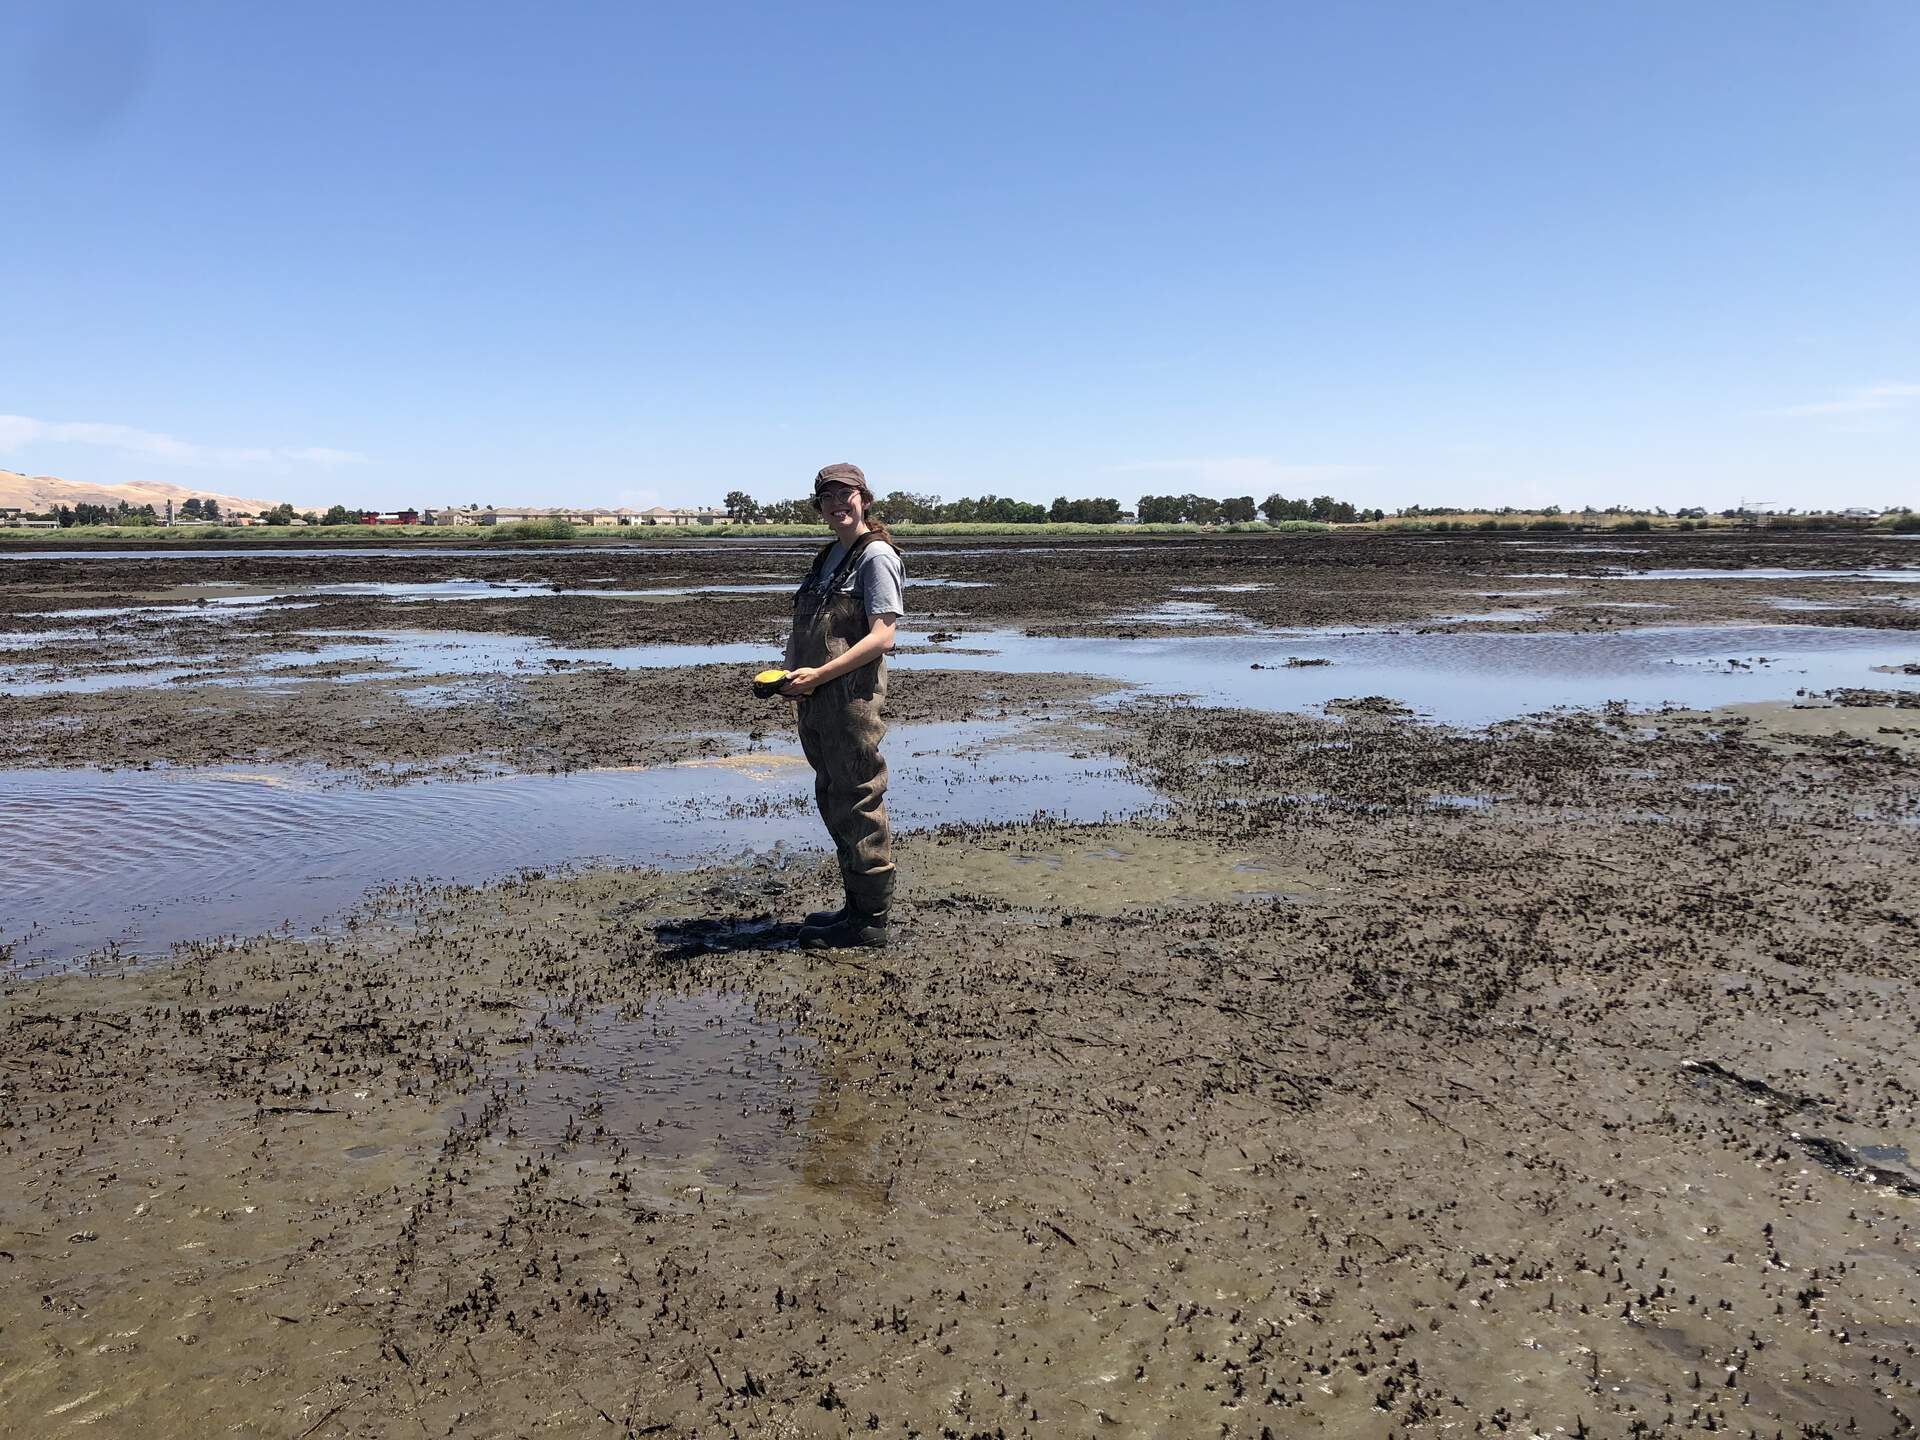
20240723HS_Irene.jpg ( 2024-07-23 12:27:23 ) Full size: 1920x1440
Irene taking GPS points

20240723HS_RaisedSensors.jpg ( 2024-07-23 13:56:37 ) Full size: 1440x1920
Raised all water level sensors 10-15cm to raise them above the mud
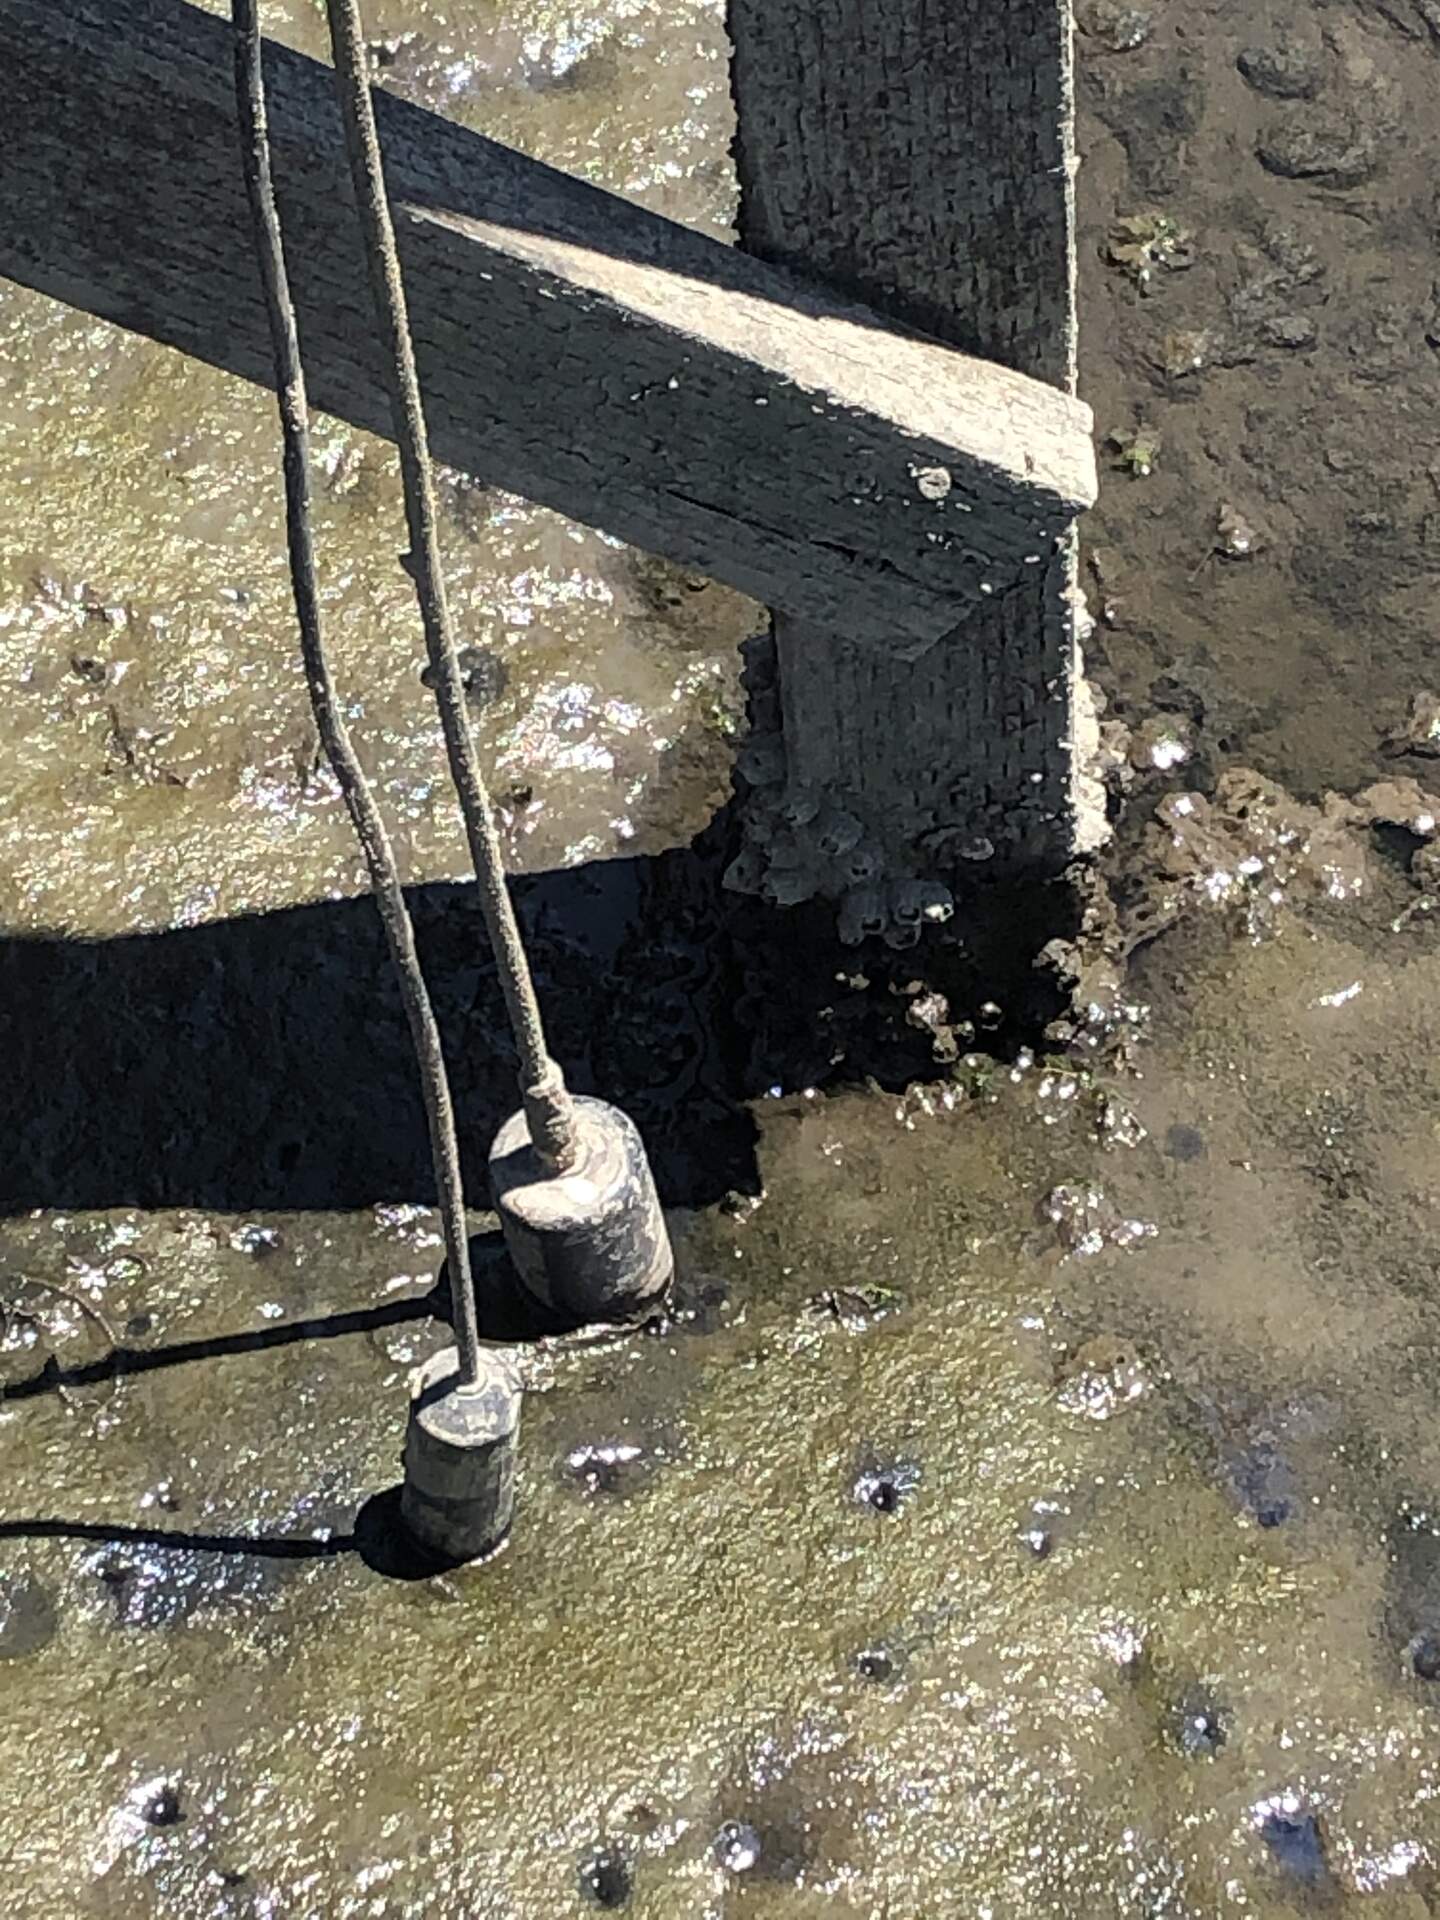
20240723HS_SensorsMud.jpg ( 2024-07-23 13:01:35 ) Full size: 1440x1920
CTD and eosGP sensor were in the mud when we arrived
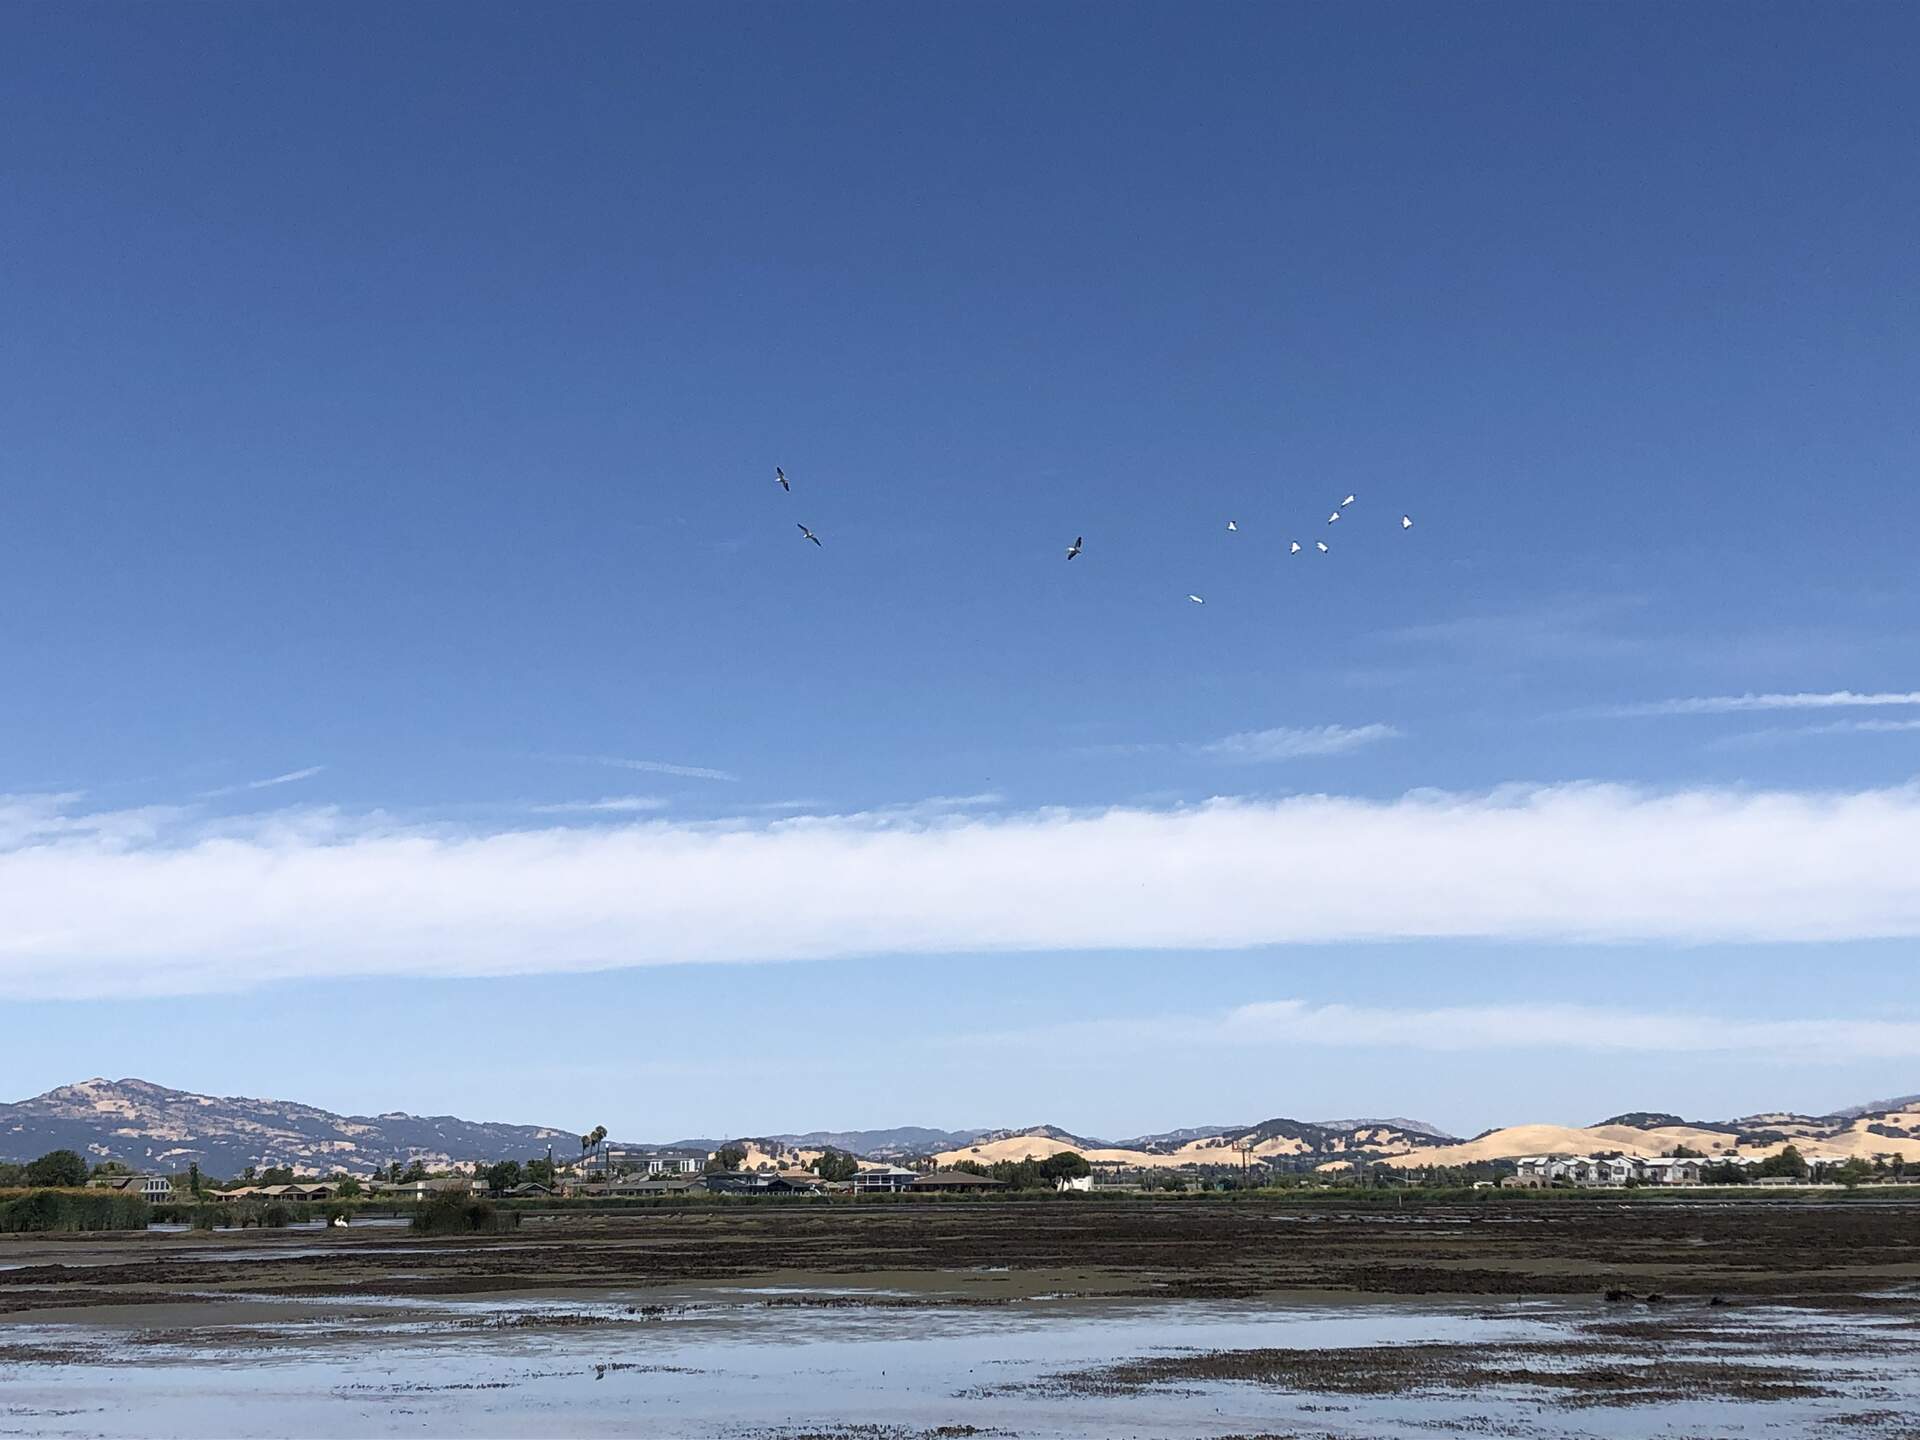
20240723HS_WhitePelicans.jpg ( 2024-07-23 12:31:36 ) Full size: 1920x1440
White pelicans (?) flying above the wetland
4 sets found
21 HS_met graphs found
4 HS_flux graphs found
1 HS_cam graphs found
Can't check HS_Processed
2 HS_Processed graphs found