
Field Notes
<--2024-01-02 10:20:00 | 2024-02-09 11:15:00-->Other sites visited today: Hill Slough | Tonzi
Phenocam link: Searching...
Vaira: 2024-01-25 11:30:00 (DOY 25)
Author: Joe Verfaillie
Others:
Summary: Standard fieldwork, checked on BF3
| Vaira 2024-01-25 I arrived at 11:30 PST. It was a nice spring-like day with blue sky, white clouds and green grass. There has been serval days of rain. The water hole is about a third full and puddles on the road. There are lots of mushrooms coming up. I measured the well and collected the flux, met, camera and FD data. The 7500 read: 427.0ppm CO2, 481.8mmol/m3 H2O, 21.5C, 100.7kPa, 99.7SS 7500 temp is often high due to sun heating. I checked on the BF3. It had some condensation inside its dome. I removed the used desiccant bags and made a new container with some origami to added fresh loose desiccant. I tightened the connector on the side of the box by less than a quarter turn. I did spectra measurement in a gap between clouds. I left at about 12:00 noon |
Field Data
No tank data
Well Depth
| Date | Location | Depth (feet) |
|---|---|---|
| 2024-01-25 | VR_well | 59.8 |
| 2024-01-25 | TZ_floor | 29.65 |
| 2024-01-25 | TZ_road | 37.8 |
| 2024-01-25 | TZ_tower | 34.4 |
No TZ Moisture Point data found
No VR Moisture Point data found
No TZ grass heigth found
No VR grass heigth found
No VR Tree DBH found
No water potential data found
No VR Grass Biomass data found
No VR OakLeaves Biomass data found
No VR PineNeedles Biomass data found
1 photos found
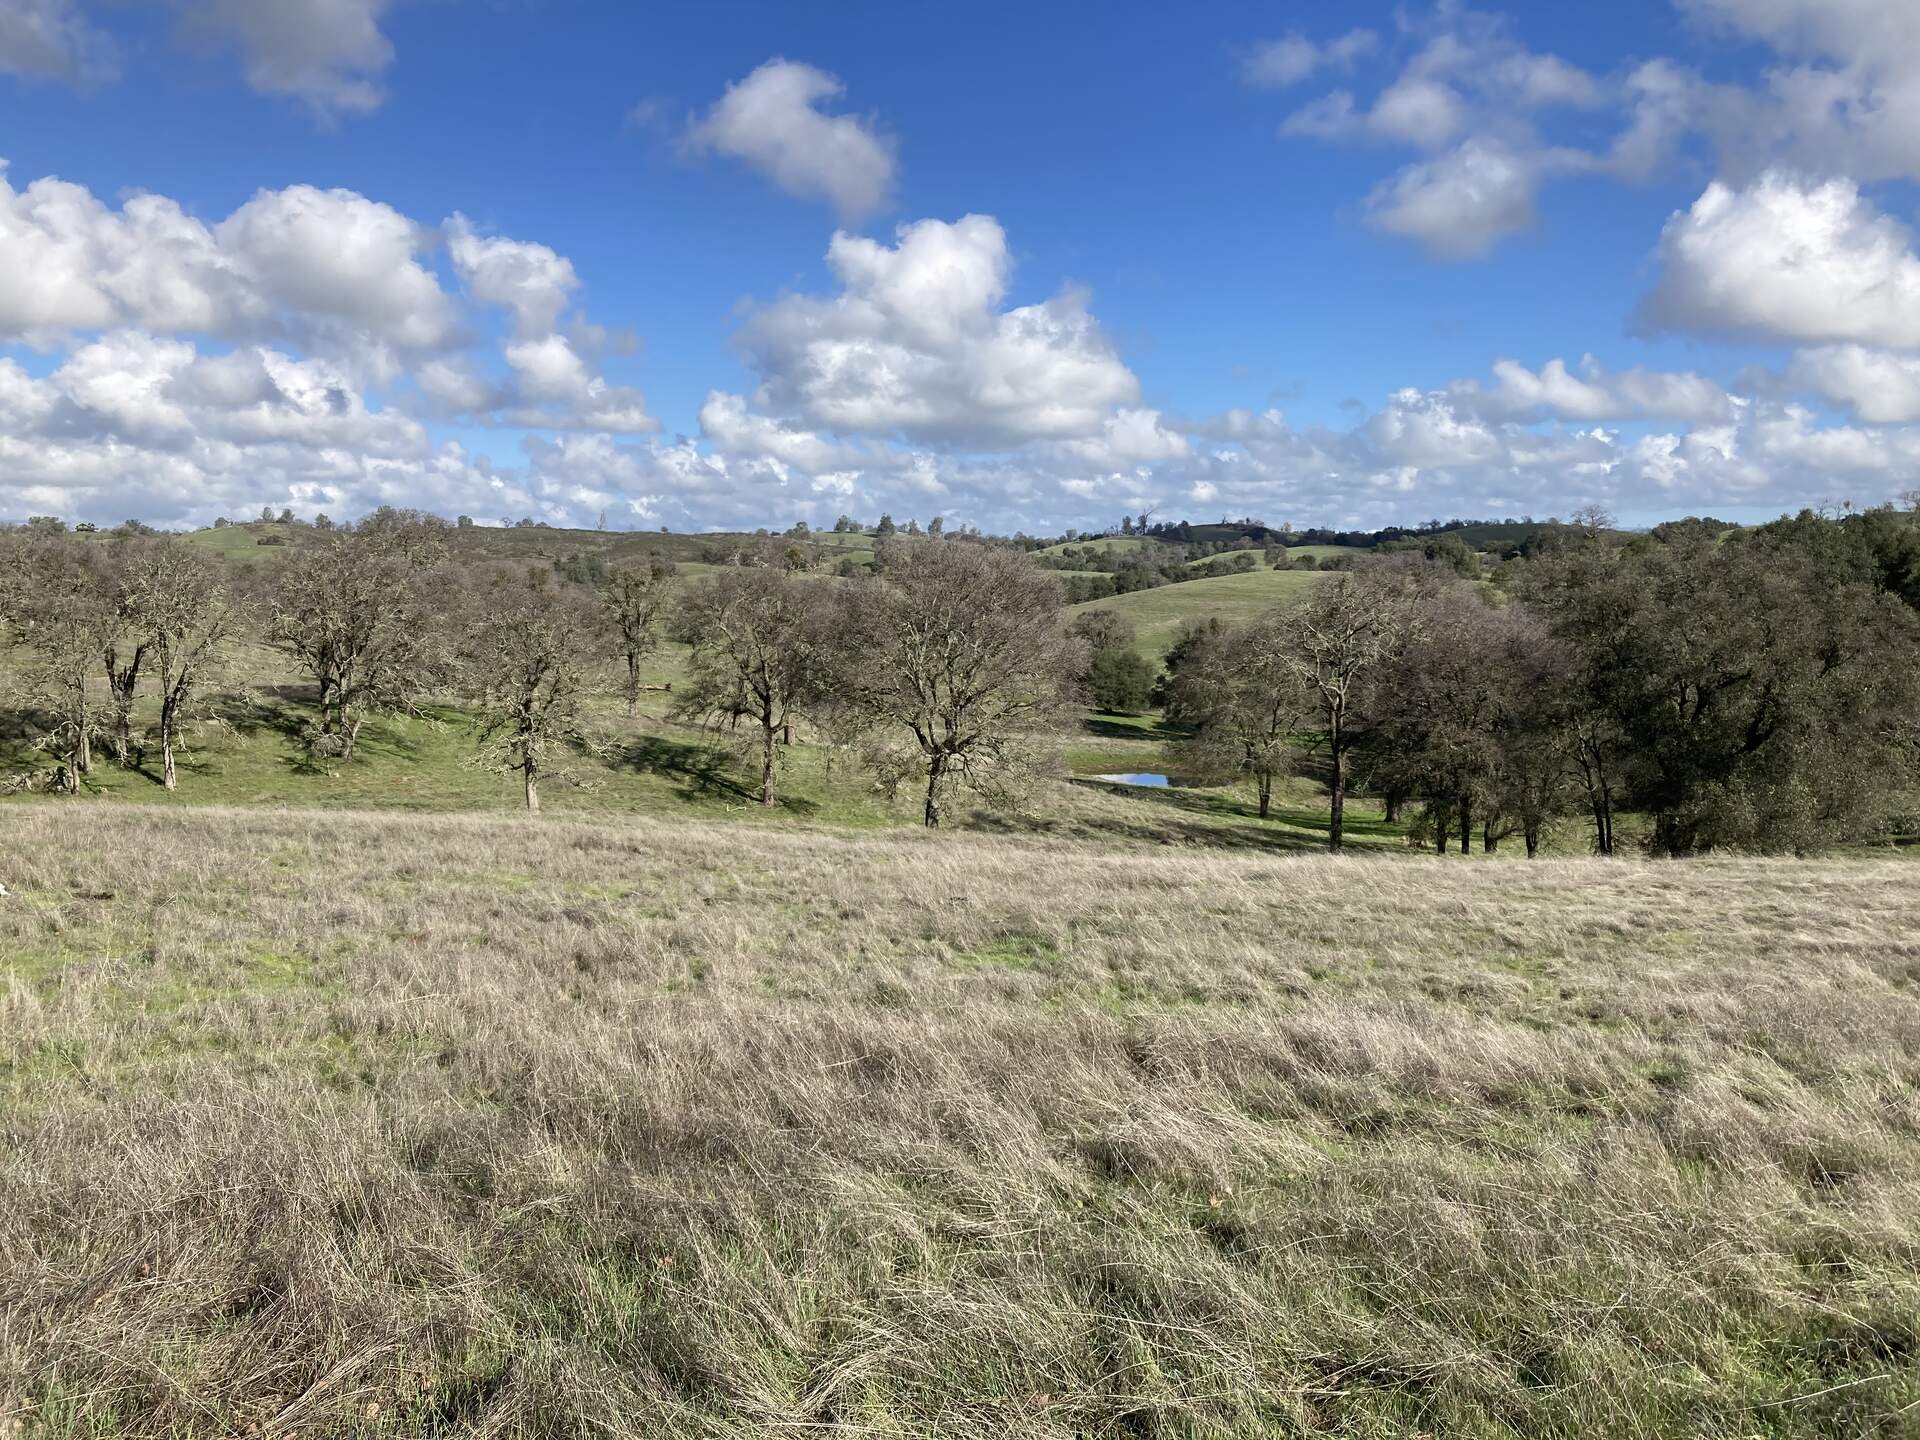
20240125VR_NiceDay.jpg ( 2024-01-25 11:36:32 ) Full size: 1920x1440
Nice spring like day after a lot of rain
9 sets found
16 VR_met graphs found
2 VR_flux graphs found
No data found for VR_soilco2.
2 VR_pond graphs found
Can't check TZVR_mixed
3 VR_fd graphs found
4 VR_processed graphs found
4 VR_arable graphs found
6 VR_soilvue graphs found