
Field Notes
<--2024-01-25 11:30:00 | 2024-02-16 14:30:00-->Other sites visited today: Tonzi
Phenocam link: Searching...
Vaira: 2024-02-09 11:15:00 (DOY 40)
Author: Joe Verfaillie
Others: Jackie
Summary: Jackie from Keenan lab visiting, very wet, pond full, swapped Arable Mark3, some missing data from the pond, big storms tilted solar panel, new tree down
| Vaira 2024-02-09 I arrived at about 11:15 with Jackie Reu from the Keenan Lab. Jackie is a new grad student this fall, likes field work, is interested in nutrient cycling but not sure what to pursue as a thesis. It was a lovely sunny but cool day fresh after a week or so of rain. Water, water everywhere. The water hole is full and the pond was spilling over. The AWD SUV was able to make it up the hill to the pond though. We tried to measure the well but the depth meter was kind of intermittent. Daphne put a new battery in it not too long ago and another fresh battery didn’t help. Taking it apart Jackie spotted a disconnected black wire. It had broken loose from a solder point on a board. We were able to resolder it and the well meter worked much better. But it could probably use a better quality fix in the lab. Jackie then helped swap out the Arable Mark 3. The new one has a fancy 2D sonic anemometer but the way everything fits together the sonic and the solar panel are on the same side. So either you point the solar panel south and shade the radiometers with the sonic, or point the solar panel north and avoid shading the radiometers. We split the difference and pointed the solar panel to the southwest which put the sonic to the northwest. This meant moving the Arable mounting post from west of the met tower to the east of the met tower. This might be a better location in that the Arable is now looking at the grazed pasture outside our fence instead of the overgrown weeds inside our fence. In the end Mark 3 sn B301042 came off and sn D006920 went on along with sonic sn 022365416. While all this was going on, I collected the met, flux, camera and FD data. The 7500 read: 432.8ppm CO2, 360.3mmol/m3 H2O, 17.4C, 100.2kPa, 99.6SS All seemed well. The solar panels were a bit tilted. I straightened them up and secured them but the ground is really soft. Must have been a big storm out here – I think there was one or two new trees down. We went to the pond, the stream is flowing, the pond is full and spilling over. The staff gauge read 22.28ft. The most recent data was missing from the file. The power of gotten too low and the CR10X lost its program – this happened about the same time last year. It may need diodes on the solar panel. We left at about 12:40 |
Field Data
No tank data
Well Depth
| Date | Location | Depth (feet) |
|---|---|---|
| 2024-02-09 | VR_well | 57.1 |
| 2024-02-09 | TZ_floor | 27.6 |
| 2024-02-09 | TZ_road | 35.1 |
| 2024-02-09 | TZ_tower | 31.7 |
No TZ Moisture Point data found
No VR Moisture Point data found
No TZ grass heigth found
No VR grass heigth found
No VR Tree DBH found
No water potential data found
No VR Grass Biomass data found
No VR OakLeaves Biomass data found
No VR PineNeedles Biomass data found
3 photos found
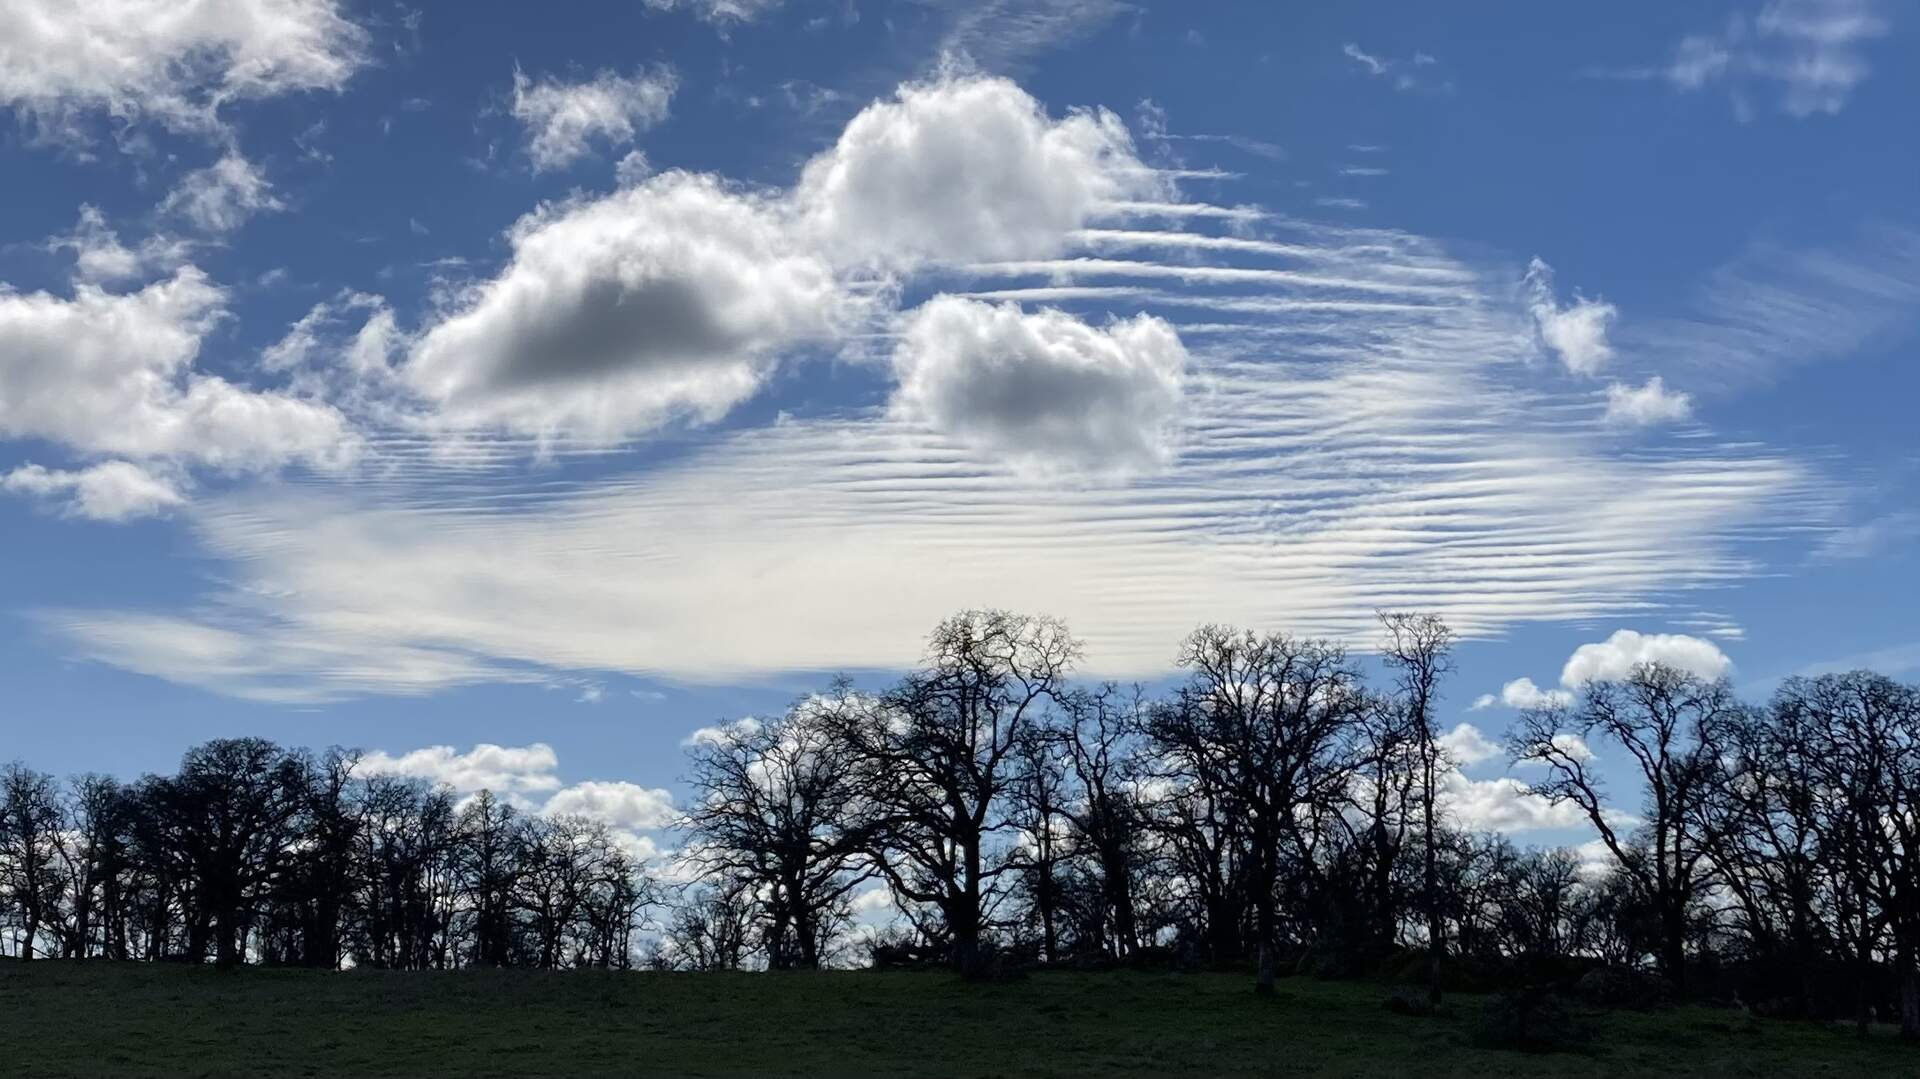
20240209VR_CoolClouds.jpg ( 2024-02-09 12:16:47 ) Full size: 1920x1079
Cool clouds

20230209VR_Site.jpg ( 2024-02-09 12:13:16 ) Full size: 1920x1440
Site with Arable Mark 3 in new location
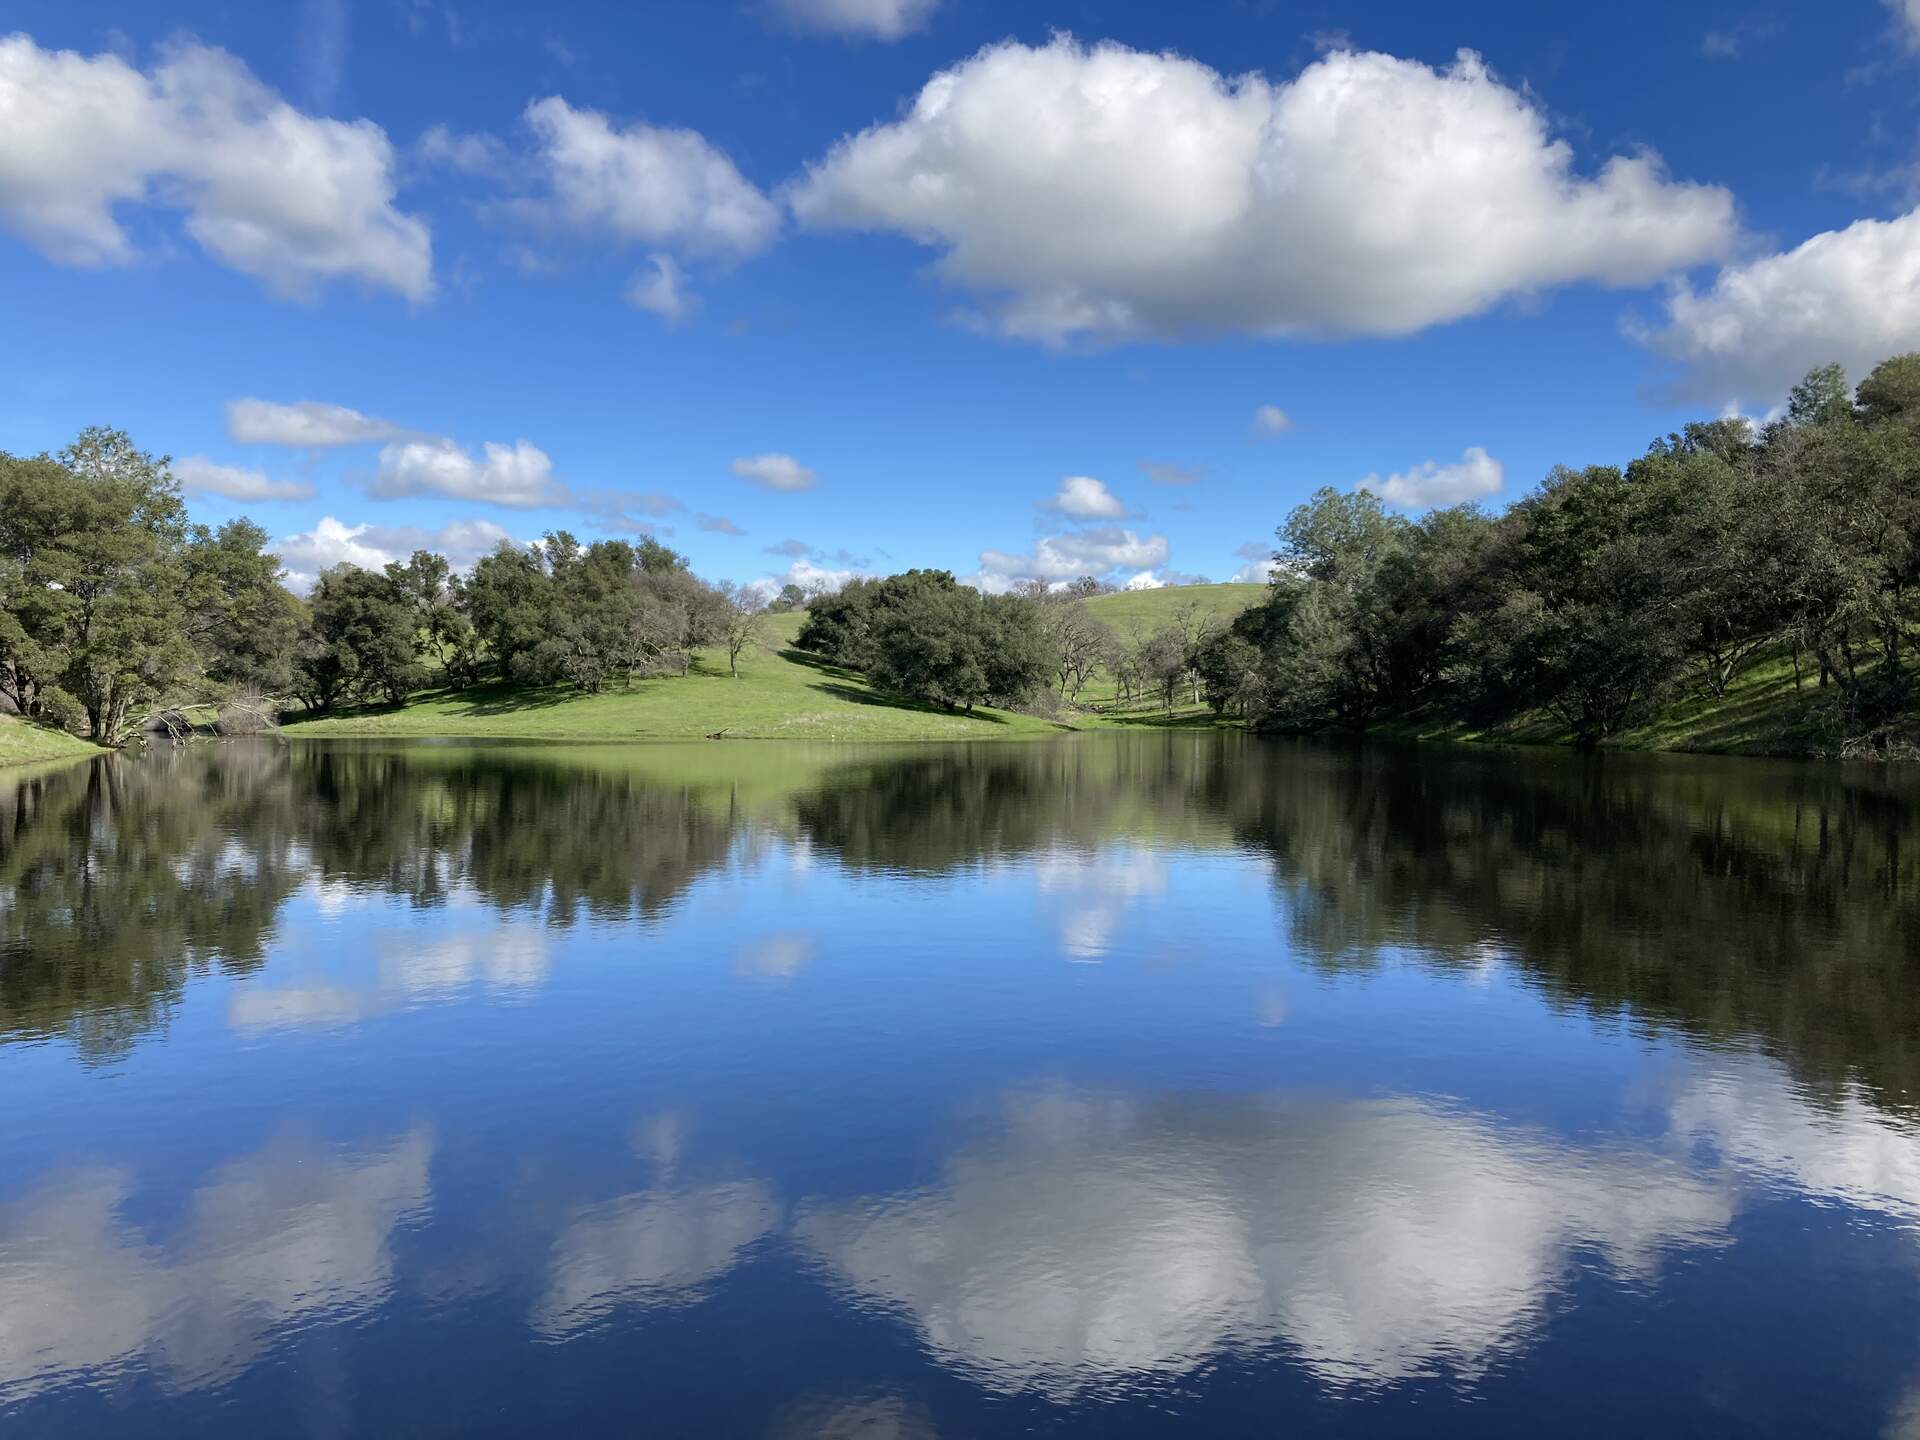
20230209VR_Pond.jpg ( 2024-02-09 12:33:07 ) Full size: 1920x1440
The pond is full.
9 sets found
16 VR_met graphs found
2 VR_flux graphs found
No data found for VR_soilco2.
No data found for VR_pond.
Can't check TZVR_mixed
3 VR_fd graphs found
4 VR_processed graphs found
4 VR_arable graphs found
6 VR_soilvue graphs found