Field Notes
<--2024-01-02 11:15:00 | 2024-02-09 12:50:00-->Other sites visited today: Hill Slough | Vaira
Phenocam link: Searching...
Tonzi: 2024-01-25 12:15:00 (DOY 25)
Author: Joe Verfaillie
Others:
Summary: Cows broke all the fences and disturbed things, reglued Zcam-1 window, Zcam-2 and 3 lost power - restored. FD open, PPT, IRT and Rnet tipped by cows, collected pt denro data
| Tonzi 2024-01-25 I arrived at 12:15 PST. It was a nice spring-like day with blue sky, white clouds and green grass. There has been serval days of rain and the ground is completely saturated. The pond doesn’t seem to have added much water and the ground water is about the same. Young punk cows trashed all the fences and disturbed things. I collected the Tower flux and camera data and the Floor flux and well data. The Tower read: 425.3ppm CO2, 427.8mmol/m3 H2O, 16.0C, 99.7kPa, 99.8SS The Floor read: 424.6ppm CO2, 454.6mmol/m3 H2O, 16.9C, 99.8kPa, 99.4SS Cows had pulled the cable off of Zcam-2. I plugged it back in and it seemed to work. They had also chewed the Zcam-3 cable. I spliced the bad section with a screw terminal and put it in a plastic bag. There was no camera in Zcam-1 which is a good thing because it is still leaking – the plastic bag I had tied over it was gone. The desiccant I put in last time was wet and looked like dark purple caviar. I cleaned up all the water as best I could, removed the window, cleaned up the old sealant and glued the window back in place. We will see if it leaks again before it gets a camera. The cows had broken the fence around the Floor tower. I reset a fence post and added a strand of barbed wire to the fence. No other damage other than the chewed camera wire. At the soil CO2 site the cows had knocked over the open FD chamber, turned and tilted the net radiometer, tilted the tipping bucket, and opened the battery box for the fence charger and disconnected the battery along with totally destroying the fence. I moved two fence posts to make the fence line a little smaller and added two more fence post to make some long runs shorter. There was a wet sucking sound when I pulled the fence post from the ground. The cows had also dumped the water potential table and extension saw. I collected the FD data, did the manual soil moisture and well depths and read the dendrometers. I didn’t collect the Road well pressure data because I forgot the power plug for the old laptop. It should be fine until next time. I collected the Point Dendrometer data. The solar panel I added on Tree 1 seems to keep the batteries charged. I also still need to figure out how to reset their clocks to PST instead of PDT. The ground IRT sensor was out of its mount but still generally pointed at the ground – MEAN COWS! I left at about 17:00 PST |
Field Data
No tank data
Well Depth
| Date | Location | Depth (feet) |
|---|---|---|
| 2024-01-25 | VR_well | 59.8 |
| 2024-01-25 | TZ_floor | 29.65 |
| 2024-01-25 | TZ_road | 37.8 |
| 2024-01-25 | TZ_tower | 34.4 |
No TZ Moisture Point data found
No VR Moisture Point data found
No TZ grass heigth found
No VR grass heigth found
Tree DBH
| Date | Tag# | Reading (mm) |
|---|---|---|
| 2024-01-25 | 1 | 20.2 |
| 2024-01-25 | 102 | 10.4 |
| 2024-01-25 | 2 | 16.1 |
| 2024-01-25 | 245 | 10.4 |
| 2024-01-25 | 3 | 6.8 |
| 2024-01-25 | 4 | 8.8 |
| 2024-01-25 | 5 | 17.9 |
| 2024-01-25 | 6 | 7.6 |
| 2024-01-25 | 7 | 14.9 |
| 2024-01-25 | 72 | 7.1 |
| 2024-01-25 | 79 | 7.1 |
No water potential data found
No TZ Grass Biomass data found
No TZ OakLeaves Biomass data found
No TZ PineNeedles Biomass data found
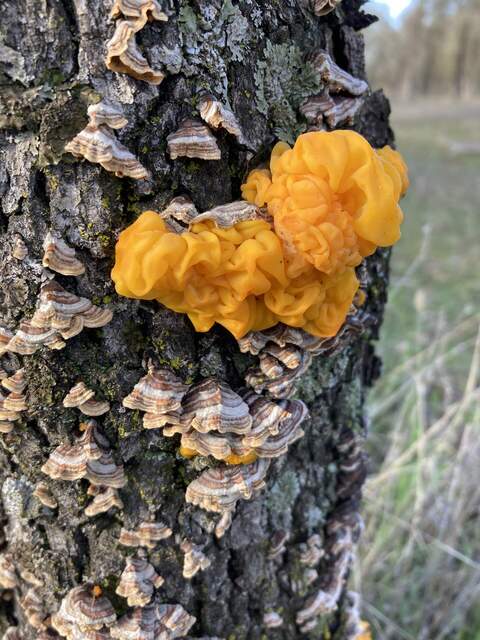
1 photos found

20240125TZ_CoolMushrooms.jpg ( 2024-01-25 14:35:20 ) Full size: 1440x1920
Bright yellow fungus that seems to be related to more mundane tree mushrooms
16 sets found
No data found for TZ_Fenergy.
11 TZ_tmet graphs found
No data found for TZ_soilco2.
Can't check TZ_mixed
3 TZ_mixed graphs found
1 TZ_fflux graphs found
8 TZ_fmet graphs found
No data found for TZ_tram.
3 TZ_co2prof graphs found
1 TZ_irt graphs found
No data found for TZ_windprof.
1 TZ_tflux graphs found
8 TZ_sm graphs found
Can't check TZ_met
1 TZ_met graphs found
Can't check TZVR_mixed
8 TZ_osu graphs found
3 TZ_fd graphs found
Tonzi Z-cam data

