Field Notes
<--2024-01-18 16:35:00 | 2024-01-30 15:45:00-->Other sites visited today: Vaira | Tonzi
Phenocam link: Searching...
Hill Slough: 2024-01-25 09:15:00 (DOY 25)
Author: Joe Verfaillie
Others:
Summary: Turkey vultures, Reinstalled calibrated EXO without auto brush
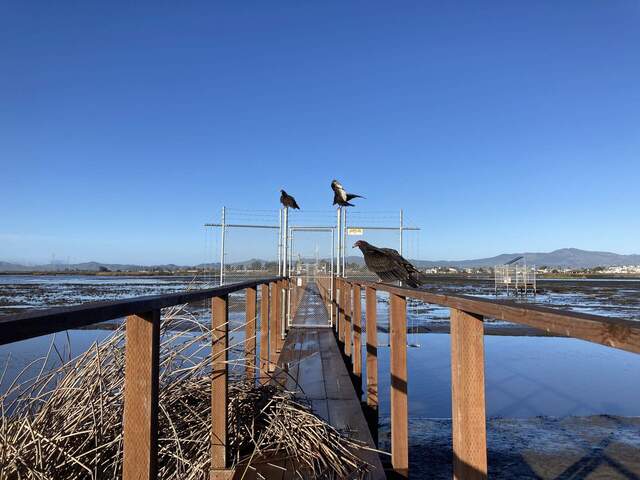
| Hill Slough 2024-01-25 I arrived at about 9:15 PST. It was clear sunny and mild. The water was near low tide and the staff gauge read 3.64 at 9:25 PST. There were three turkey vultures guarding the entrance to the boardwalk – maybe not the best omen to begin the day. They moved off down the boardwalk as I approached. This was a quick stop to reinstall the freshly calibrated EXO. The automated brush has be removed for repair. The blue tooth LED was lit and the red LED was blinking. When I first put it in it sank to the bottom to sit on the mud before I realized that the yellow chain would hold it higher than its cable. Being attached to the yellow chain kept the sensors out of the mud. Sensors installed: sn 22C103416 EXO2 sn 22E106072 Turbidity sn 22E100649 fDOM sn 23D104030 Conductivity/Temperature sn 22D102641 pH/ORP I checked the other water sensors to make sure they were not in the mud. I put the lubricant on the EXO connector pins and then accidently dropped the nearly empty tube into the water and watched it slowly float away with the tide. I left at about 9:30 |
2 photos found

20240125HS_TurkeyVultures.jpg ( 2024-01-25 09:17:22 ) Full size: 1920x1440
Turkey vultures guarding the approach to the boardwalk.

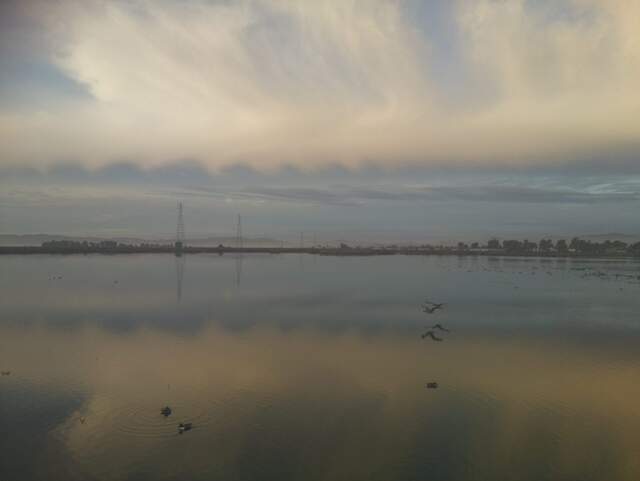
HS_picam_20240126_0745.jpg ( 2024-01-26 07:45:05 ) Full size: 1917x1440
Strange scalloped clouds and birds
4 sets found
21 HS_met graphs found
4 HS_flux graphs found
1 HS_cam graphs found
Can't check HS_Processed
2 HS_Processed graphs found

