
Field Notes
<--2023-12-13 17:00:00 | 2024-01-04 10:35:00-->Other sites visited today: Gilbert Tract | Mayberry | West Pond | East End | Bouldin Alfalfa | Hill Slough
Phenocam link: Searching...
Bouldin Corn: 2023-12-22 14:10:00 (DOY 356)
Author: Joe Verfaillie
Others: Arman
Summary: The field is flooded, Helped Charlotte remotely with water in her analyzer, some power outages
| Bouldin Corn 2023-12-22 Arman and I arrived at 14:10 PST. It was a clear, sunny and mild first day of winter. Our field is flooded. Charlotte called me this morning from LA saying that one of her analyzers had water in it. I got a key from her lab mate, Jeff, for two locks on a big chain around the box but didn’t have a key for the four locks on the edges. Fortunately the hasps had been put on so that their screws are exposed – a few minutes with a screw driver and we had the box open. I shut things down, removed a filter and dumped about a teaspoon of water out of it. Following instruction from Charlotte on the phone I put the filter back and restarted the system with everything just pulling air from inside the box to dry things out. Arman also pulled from the field chamber #12 which was almost under water. We reassembled the box – I left two pieces of tubing under the tarp on top of the box. At the tower I collected the flux, met, camera, IRT and PA data. Arman cleaned the eddy sensors and radiometers. The 7500 read: 440.6ppm CO2, 556.1mmol/m3 H2O, 20.6C, 101.3kPa, 100.9SS The 7700 read: 2.06ppm CH4, 38RSSI – 78.7 after cleaning We topped up the wash reservoir. There have been a few power outages. Partly the duck club might be browning out the panel when combined with all of Charlotte’s stuff. We left at 15:15 PST |
2 photos found

20231222BC_FieldFlooded.jpg ( 2023-12-22 15:11:36 ) Full size: 1920x1440
The field has been flooded for winter.
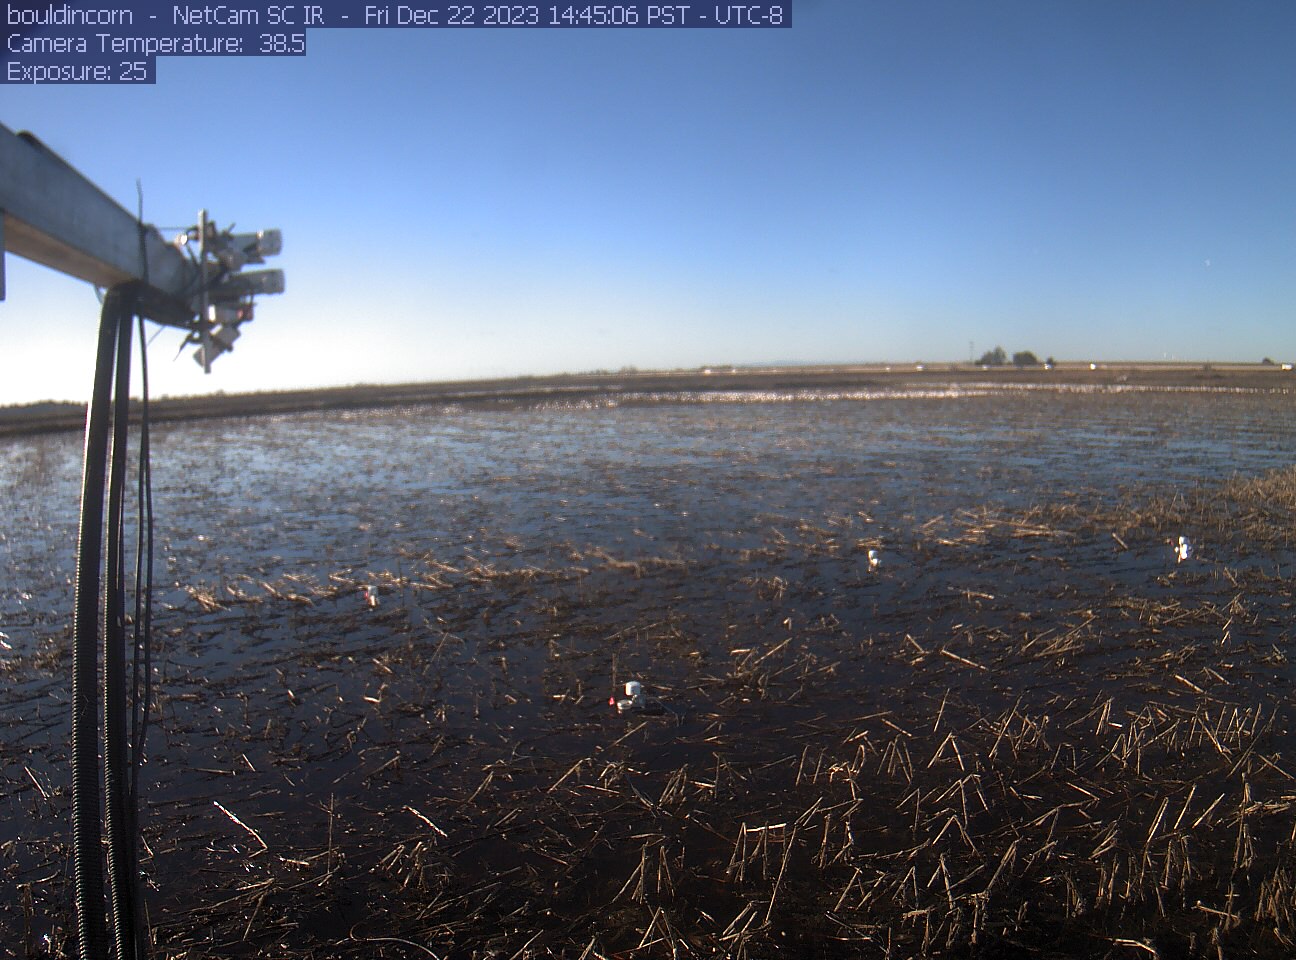
bouldincorn_2023_12_22_144506.jpg ( 2023-12-22 22:46:40 ) Full size: 1296x960
Geese in flooded field
6 sets found
17 BC_met graphs found
5 BC_flux graphs found
Can't check TATWBABCSB_cam
Can't check MBSWEEWPBCBA
2 BC_pa graphs found
1 BC_arable graphs found