
Field Notes
<--2023-12-07 14:35:00 | 2023-12-22 14:10:00-->Other sites visited today: Hill Slough | Vaira | Tonzi
Phenocam link: Searching...
Bouldin Corn: 2023-12-13 17:00:00 (DOY 347)
Author: Joe Verfaillie
Others:
Summary: Checked on power outages reported by Charlotte, collected Licor USB data, not flooded yet.
| Bouldin Corn 2023-12-13 I arrived at about 17:00 PDT. While I was at Tonzi today, Charlotte texted to say that the power was going out at BC. I stopped to check on things. It was just getting dark and some duck hunters pulled in after me in their ATV. They said that they haven’t seen any ducks yet and only got some Canada geese. Maybe the warmer fall has kept the ducks further north. There was a little bit of water in the field to our north, but our field was dry. All the power was on and I didn’t see any problems. I taped a connection between the two extension cords hoping I wasn’t trapping more water in than preventing more from entering. I collected our flux data to see the power outages that Charlotte was talking about. They seem to be very short restarts – probably won’t affect our data much. Something must be browning out the power for very short periods. Might be happening upstream at the duck club. I left at about 17:15 |
3 photos found
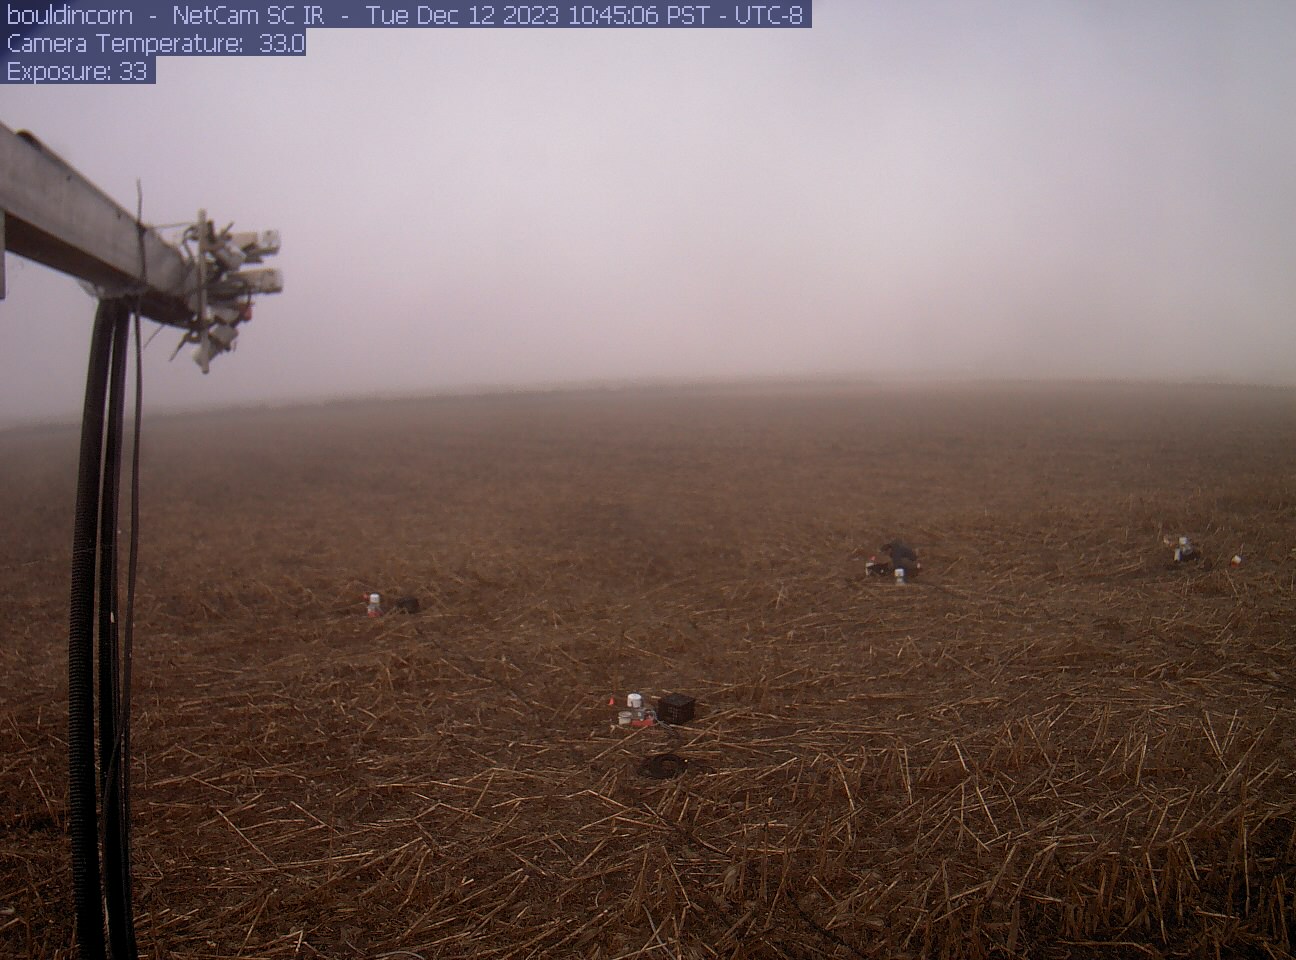
bouldincorn_2023_12_12_104506.jpg ( 2023-12-12 18:46:32 ) Full size: 1296x960
Chambers getting installed

bouldincorn_2023_12_12_114506.jpg ( 2023-12-12 19:46:36 ) Full size: 1296x960
Chambers getting installed
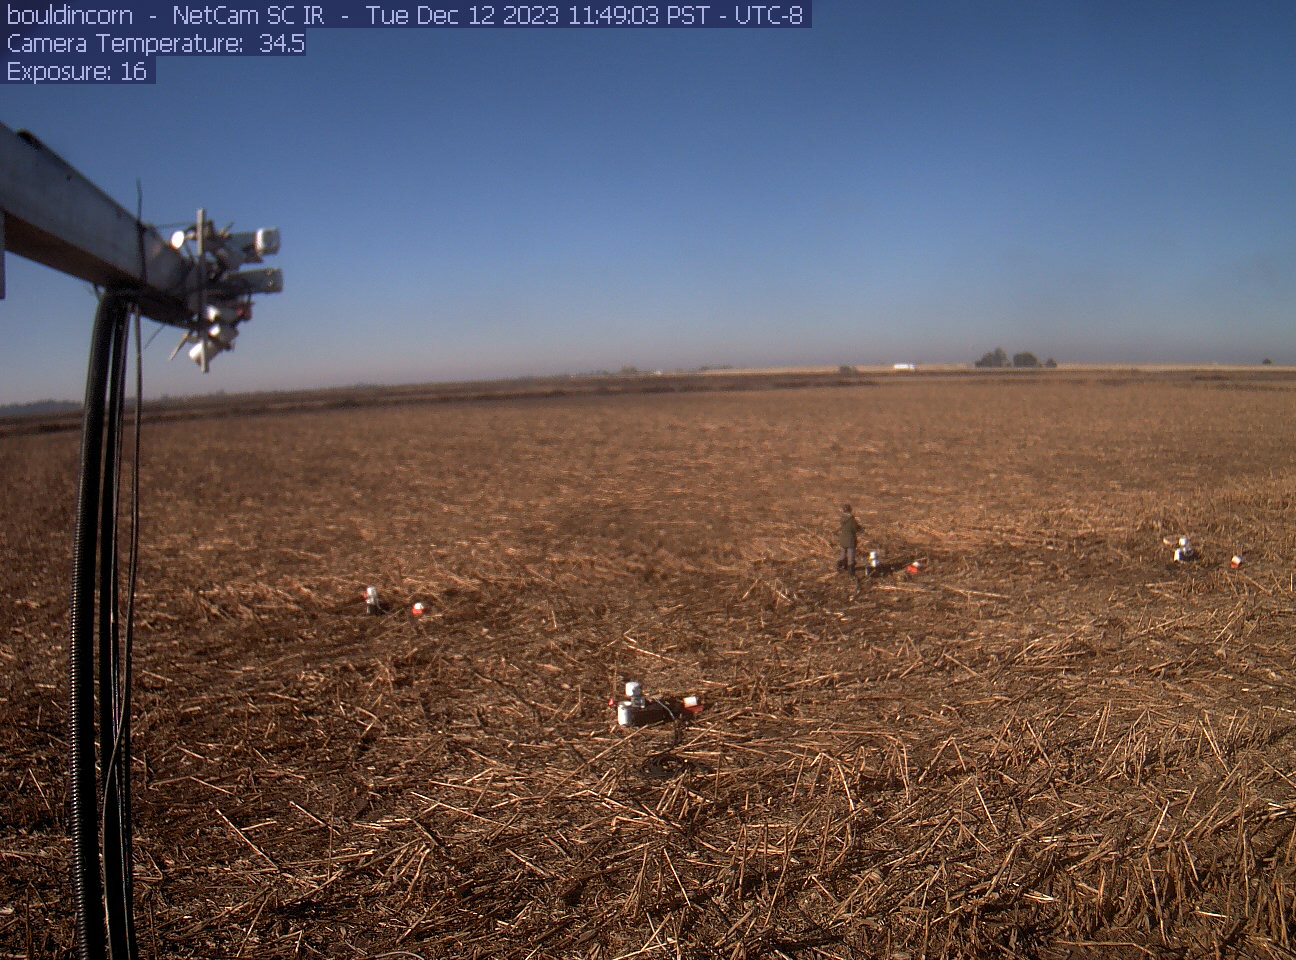
bouldincorn_2023_12_12_114903.jpg ( 2023-12-12 19:50:32 ) Full size: 1296x960
Chambers getting installed
6 sets found
17 BC_met graphs found
5 BC_flux graphs found
Can't check TATWBABCSB_cam
Can't check MBSWEEWPBCBA
2 BC_pa graphs found
1 BC_arable graphs found