Field Notes
<--2023-12-07 16:05:00 | 2023-12-22 16:50:00-->Other sites visited today: Vaira | Tonzi | Bouldin Corn
Phenocam link: Searching...
Hill Slough: 2023-12-13 09:23:00 (DOY 347)
Author: Joe Verfaillie
Others:
Summary: Quick stop to add a brush the EXO wiper and collect the met data that was missed last time.
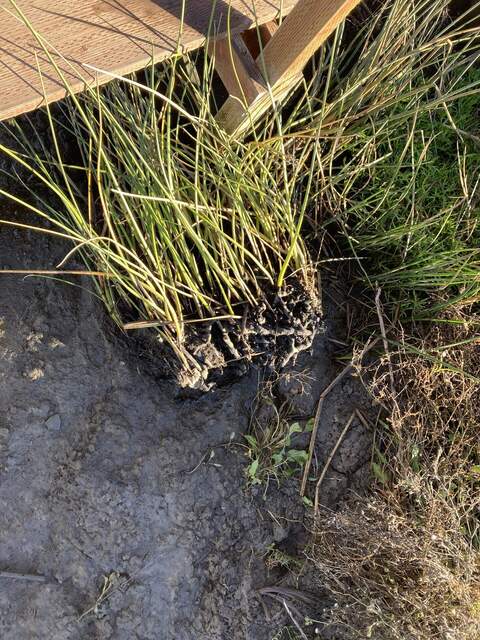
| Hill Slough 2023-12-13 I arrived at 9:23 PST. It was clear, sunny and cool with only a very light breeze. The tide was low with the channel staff gauge reading 3.58ft. This was a quick stop to add a brush to the EXO wiper and collect the met data that was missed last week. The water level was just above the top of the miniDot and more than half of the EXO body was out of the water. We might need to think about a horizontal mount – I’m not sure how sun on the body might change temperatures. When I pulled up the EXO there was a small fish inside the guard. The sensor windows looked clean. I put the new brush on the wiper axel – the old one had fallen off. The axel is keyed and I had to twist the motor to the parking position but otherwise it seemed fine. At the tower I set up a new connection in LoggerNet and downloaded the met data by date range. The Licor logging status light was good. I wiped a bunch of spider webs off the eddy sensors. There was a plug of tules at the beginning of the boardwalk that had floated loose from somewhere. I think king tides are coming soon. I left at 9:50 for Tonzi and Vaira |
1 photos found

20231213HS_TulePlug.jpg ( 2023-12-13 09:49:09 ) Full size: 1440x1920
A tule plug has floated loose from somewhere
4 sets found
21 HS_met graphs found
4 HS_flux graphs found
1 HS_cam graphs found
Can't check HS_Processed
2 HS_Processed graphs found

