
Field Notes
<--2023-09-12 16:05:00 | 2023-09-28 12:25:00-->Other sites visited today: Vaira | Tonzi | West Pond
Phenocam link: Searching...
Bouldin Alfalfa: 2023-09-19 10:00:00 (DOY 262)
Author: Joe Verfaillie
Others: Brian
Summary: Quick stop to take down the NIKIRA fast H2O and AirT sensor. Got the tower clipped just as a mower arrived
| Bouldin Alfalfa 2023-09-19 Brian Leen (NIKIRA) and I arrived at about 10:00 am PDT. Traffic on Hwy 12 was bad probably from the draw bridge having been drawn. Also dump trucks were making loops out the gate we usually come in and we had to wait for one to clear the gate. It was mild and sunny. A mower was just finishing up on the field to our east and started on our field soon after we arrived. The mower ran one pass down our edge of the field and we moved our cars into the mowed strip. I trimmed the alfalfa under the tower while Brian downloaded data from his instrument. On the third pass down our side of the field the mower did a careful doughnut around our tower. The mower is bigger than our tower. Couldn't have better timing of clipping vs mowing. We took down the NIKIRA instrument and the top section of the post it was mounted on – the lower section of the post still needs to be removed. I removed the analog cable from the 7550 box (I’m not sure where the analog cable ended up – might have left it on top of a box. I unplugged the power cable and spooled it up behind the data logger box as spare. We left at about 11:00 am PDT |
Next Mowing: 2023-09-19
1 photos found
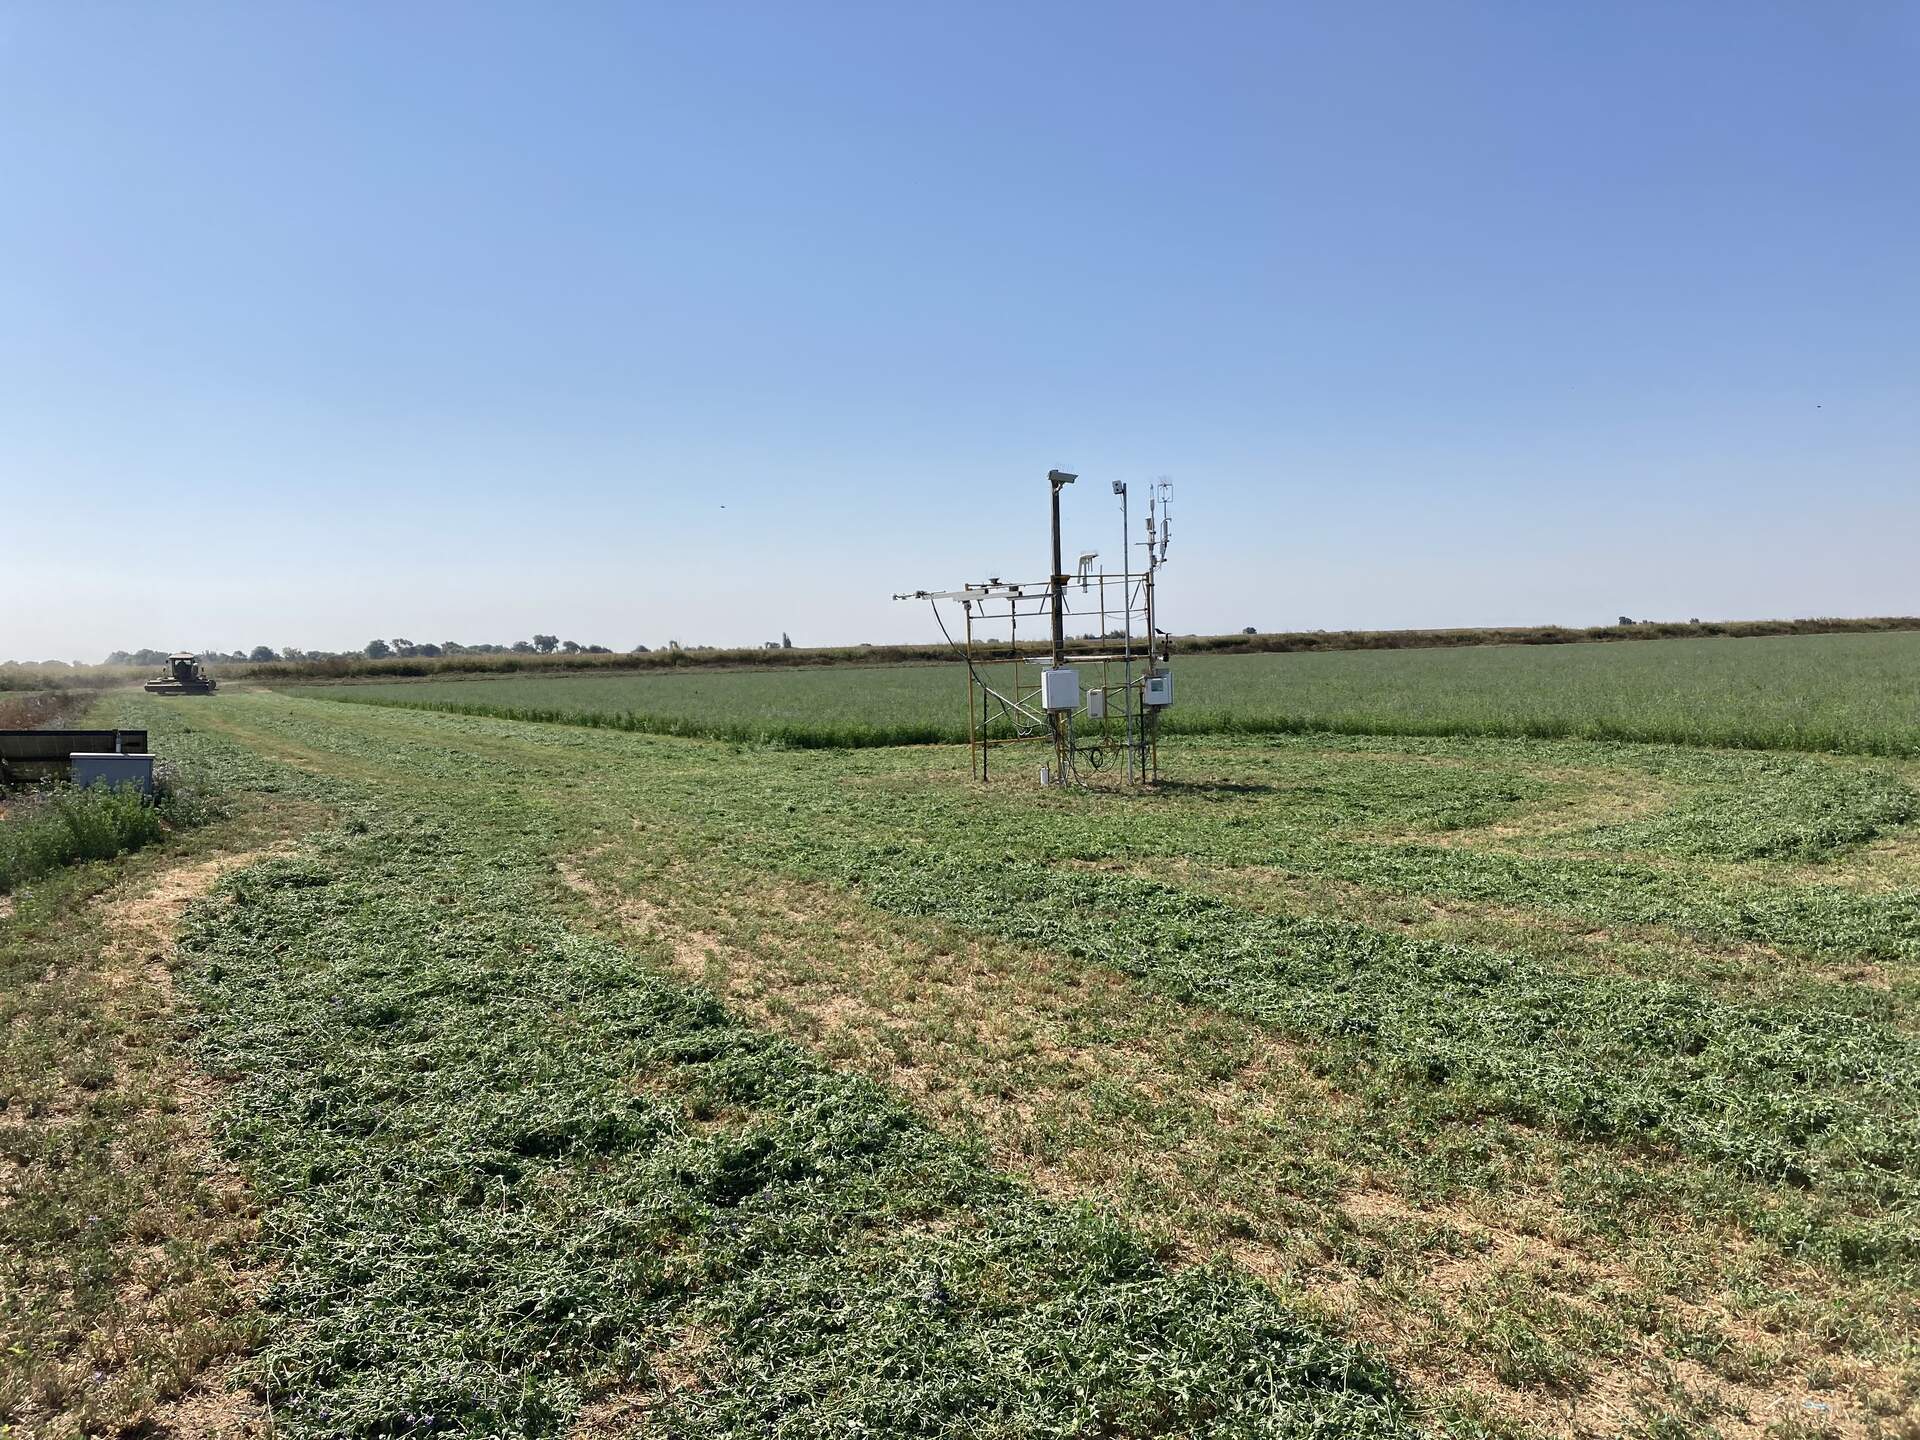
20230919BA_FreshlyMowed.jpg ( 2023-09-19 10:45:50 ) Full size: 1920x1440
We watched them mow around the tower
7 sets found
4 BA_flux graphs found
21 BA_met graphs found
6 BA_arable graphs found
Can't check TATWBABCSB_cam
Can't check MBSWEEWPBCBA
2 BA_processed graphs found
No data found for BA_adex.