Field Notes

<--2023-09-19 10:00:00 | 2023-10-11 16:15:00-->
Other sites visited today: Hill Slough | Bouldin Corn | West Pond | East End | Mayberry | Gilbert Tract

Bouldin Alfalfa: 2023-09-28 12:25:00 (DOY 271)
Author: Daphne Szutu
Others: Robert

Summary: Regular data collection/cleaning, short alfalfa

2023-09-28
Bouldin Alfalfa

Robert and I arrived around 12:25 PDT. It was sunny, windy, and clear. It smelled like sheep and/or poop when we got out of the car, but there were no sheep in sight. Later it started smelling more like silage—maybe that’s what we were also smelling initially.

The alfalfa is short and there are no more bales on the field.

I checked the undercanopy PAR sensor and it was clear of litter. It was tilted slightly to the south, so I re-leveled it.

Robert took spectral data. Halfway through, the jaz seemed to get stuck on taking the reference point. Robert power cycled the jaz and all seemed ok.

I downloaded met, cam, USB GHG, FD, and IRT data. I cleaned the flux and rad sensors; SWin and LWin sensors were both dirty, from bird feet probably. I changed the eddy clock +1:45min from 11:48:45 to 11:50 PST to match the laptop time and restarted logging.

The 7500 read: 403ppm CO2, 514mmol/m3 H2O, 26.2C, 101.2kPa, 96SS--99 after cleaning

We left at 12:55 PDT.

Next Mowing: 2023-10-17

1 photos found

Fieldwork, spectral measurements
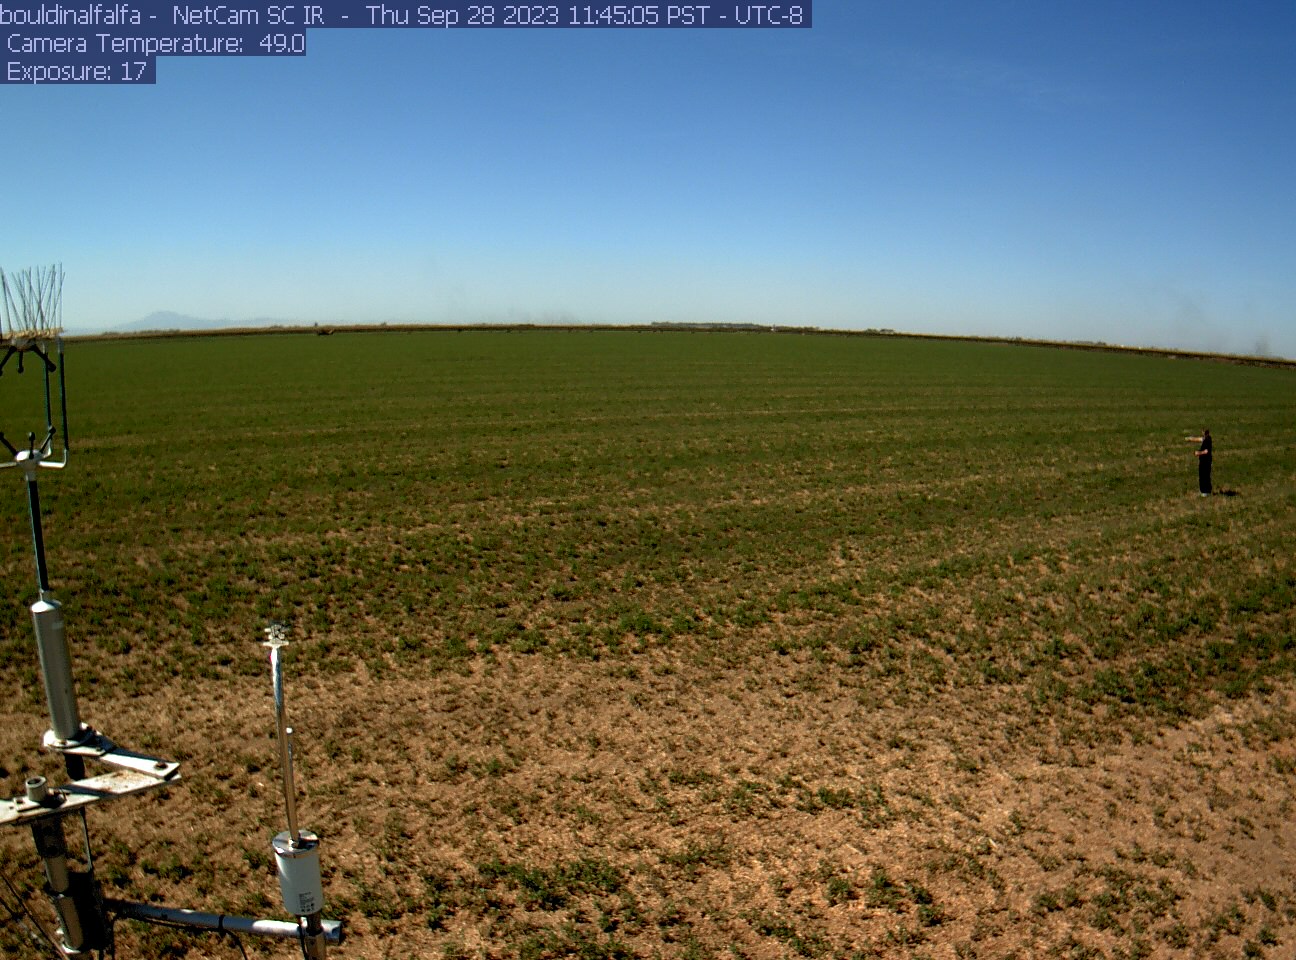
bouldinalfalfa_2023_09_28_114505.jpg ( 2023-09-28 19:45:20 ) Full size: 1296x960
Fieldwork, spectral measurements

Graphs display:
7 sets found

4 BA_flux graphs found

Explore the graph:Wind in a new window

Explore the graph:LI-7500 CO2 and H2O in a new window

Explore the graph:Counts in a new window

Explore the graph:CO2 in ppm in a new window

21 BA_met graphs found

Explore the graph:Soil Temperatures Set A in a new window

Explore the graph:Soil Temperatures Set B in a new window

Explore the graph:Soil Temperatures Set C in a new window

Explore the graph:Soil Heat Flux in a new window

Explore the graph:Temperature in a new window

Explore the graph:Solar Radiation in a new window

Explore the graph:Air Pressure and RH in a new window

Explore the graph:Soil Moisture in a new window

Explore the graph:PAR in a new window

Explore the graph:PRI Channels in a new window

Explore the graph:NDVI channels in a new window

Explore the graph:Battery Voltage in a new window

Explore the graph:NDVI and PRI in a new window

Explore the graph:Apogee NDVI in a new window

Explore the graph:FD Chamber A CO2 and Temp in a new window

Explore the graph:FD Chamber B CO2 and Temperature in a new window

Explore the graph:Surface Temperature in a new window

Explore the graph:Sentek Soil Moisture profile in a new window

Explore the graph:Sentek Soil Temperature profile in a new window

Explore the graph:Sentek Soil Salinity profile in a new window

Explore the graph:Forced Diffusion Soil CO2 Flux in a new window

6 BA_arable graphs found

Explore the graph:Incoming Solar Bands in a new window

Explore the graph:Reflected Solar Bands in a new window

Explore the graph:Solar Radiation in a new window

Explore the graph:Temperatures, PPT in a new window

Explore the graph:Sentek Deep Soil Moisture in a new window

Explore the graph:Pressure, RH in a new window

Can't check TATWBABCSB_cam
Can't check MBSWEEWPBCBA
2 BA_processed graphs found

Explore the graph:Energy in a new window

Explore the graph:Evapotranspiration in a new window

No data found for BA_adex.