Field Notes
<--2023-04-26 11:20:00 | 2023-05-30 12:40:00-->Other sites visited today: Vaira
Phenocam link: Searching...
Tonzi: 2023-05-16 12:10:00 (DOY 136)
Author: Joe Verfaillie
Others:
Summary: Hot, lots of flowers, punk cows, updated met programs for Bowen ratio stats, zcam 3 window misaligned - fixed, ground IRT distrubed - fixed, first midday water potential this season, removed calkit from Floor
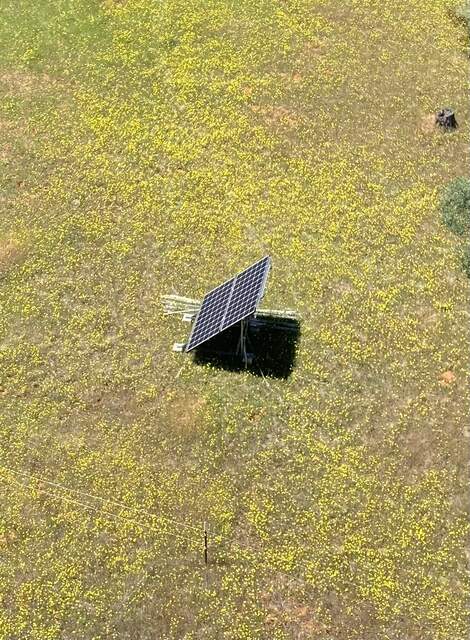
| Tonzi 2023-05-16 I arrived at about 12:10 PDT. It was clear, sunny and hot. The ground surface is dry. Flowers are blooming everywhere – my shoes were yellow with pollen. The trees have dark green leaves but look a little sparser than usual. I updated the programs on the met data loggers to add the statistics needed for Carlos’s reverse Bowen ratio method to get at H and LE. On the Tower CR1000 I added another table that does the calculations without pressure. On the Floor 23x the calculations are done with and without the pressure from the somewhat flakey Vaisala senor and added to the fmet table. I collected the Tower top data (flux, camera) and cleaned some spider webs off the 7500 before going to do midday water potential. The radiometer looked clean. The Tower read: 436.3ppm CO2, 507.3mmol/m3 H2O, 28.4C, 99.0kPa, 102.8SS As I was coming down the tower I noticed that some young cow punks had knocked one of the point dendrometer boxes off a tree and were chewing on the strap. I chased them off, cut the mangled, cow saliva soaked end of the webbing strap off and remounted the box higher on the tree. The connection to the point dendrometer is just an audio jack that disconnected when the box fell off the tree. I plugged it back in and didn’t see any damage. I didn’t have a micro SD reader with me but I should probably check that card next time. I did midday water potential: about -20bar. I thought tree 102 might die but it seems no worse than before. Then I did the rest of the data collection: moisture point, wells, DBH, Floor flux, zcams and FD chambers. A couple of the Moisture Point probes (Under, A) were giving bad readings for the top two locations. The old laptop for the Global Water logger kept switching between AC and Battery mode – need to figure that out. Last time I put the zcam 3 cover on in the wrong direction so that the camera was not lined up with the window – done in a rush last time on the way out. The Floor read: 430.5ppm CO2, 509.3mmol/m3, 31.2C, 99.1kPa, 99.5SS Cows had kicked the ground IRT around. I put it back in place. I removed the calkit from the Floor met box. CR1000 sn 4190, HMP155 sn T2930114, and an old Licor 7500 pressure sensor sn K993237. I left at about 15:30 |
Field Data
No tank data
Well Depth
| Date | Location | Depth (feet) |
|---|---|---|
| 2023-05-16 | VR_well | 48.15 |
| 2023-05-16 | TZ_floor | 15.1 |
| 2023-05-16 | TZ_road | 24.35 |
| 2023-05-16 | TZ_tower | 19.2 |
No TZ Moisture Point data found
No VR Moisture Point data found
No TZ grass heigth found
Grass Height VR 14
| Date | Height reps (cm) | Location | Average | Samp | STDEV | |||||||||||||
|---|---|---|---|---|---|---|---|---|---|---|---|---|---|---|---|---|---|---|
| 2023-05-16 | 37 | 70 | 65 | 50 | 40 | 50 | 80 | 30 | 35 | 25 | 60 | 35 | 70 | 45 | GH_ALL | 49.43 | 14 | 16.45 |
Tree DBH
| Date | Tag# | Reading (mm) |
|---|---|---|
| 2023-05-16 | 1 | 14.4 |
| 2023-05-16 | 102 | 3.7 |
| 2023-05-16 | 2 | 10.4 |
| 2023-05-16 | 245 | 7.1 |
| 2023-05-16 | 3 | 5.2 |
| 2023-05-16 | 4 | 6.9 |
| 2023-05-16 | 5 | 14.1 |
| 2023-05-16 | 6 | 5.7 |
| 2023-05-16 | 7 | 13.7 |
| 2023-05-16 | 72 | 17.9 |
| 2023-05-16 | 79 | 19.1 |
Water Potential - mode: raw
| Time | Species | Tree | readings (bar) | ||
|---|---|---|---|---|---|
| 2023-05-16 12:10:00 | OAK | 102 | -20 | -13 | -25 |
| 2023-05-16 12:10:00 | OAK | 92 | -28 | -29 | -29 |
No TZ Grass Biomass data found
No TZ OakLeaves Biomass data found
No TZ PineNeedles Biomass data found
1 photos found

20230516TZ_LotsOfFlowers.jpg ( 2023-05-16 12:52:03 ) Full size: 1199x1631
Many flowers are all blooming
16 sets found
No data found for TZ_Fenergy.
11 TZ_tmet graphs found
No data found for TZ_soilco2.
Can't check TZ_mixed
3 TZ_mixed graphs found
1 TZ_fflux graphs found
8 TZ_fmet graphs found
No data found for TZ_tram.
3 TZ_co2prof graphs found
1 TZ_irt graphs found
No data found for TZ_windprof.
1 TZ_tflux graphs found
8 TZ_sm graphs found
Can't check TZ_met
1 TZ_met graphs found
Can't check TZVR_mixed
8 TZ_osu graphs found
3 TZ_fd graphs found
Tonzi Z-cam data

